
Lead Ions Removal from Natural Water Samples by Nano-Mint Waste as Benign Low Cost Biosorbent
Tamer H. A. Hasanin1*  , Salwa A. Ahmed1 and Taghreed B. Ebrahim1
1Chemistry Department, Faculty of Science, Minia University, El- Minia , 61519 Egypt .
http://dx.doi.org/10.13005/OJPS03.02.07
Nano mint waste (NMW) was used as a low-cost nano biosorbent and efficient Pb(II) remover. pH, contact time, biosorbent dose, and concentration of metal ion were optimized using batch technique to optimize maximum capacity of this new biosorbent. NMW was characterized using FT-IR, SEM, TEM, and XRD analyses. The experimental Pb(II) adsorption data by NMW were agreed with both Freundlich and Langmuir models with maximum boisorption capacity of 2.13 mmolg-1 (441.336 mgg-1). In addition, values of lead uptake at different time vaues was best fitted with the kinetic pseudo-second order model. It will be notable that, good data resulted from the kinetic experiments study confirmed a fast accessibility of the Pb(II) to the biosorbent surface, get to equilibrium within 30 seconds. On the other hand, it was observed that, the developed method, was investigated for measuring of Pb(II) with a certain spiked amounts in natural water samples as ground water (GW), sea water (SW), drinking tap water (DTW), natural drinking water (NDW), Nile River water (NRW) and waste water (WW). The good results obtained with high recovered quantitatively using batch experiments, without matrix interferences. Considering its cheap source, environmentally friendly, economic and fast uptake process, NMW can be used as benign nano biosorbent for lead removal from real water samples.
Copy the following to cite this article:
Hasanin T. H. A, Ahmed S. A, Ebrahim T. B. Lead Ions Removal from Natural Water Samples by Nano-Mint Waste as Benign Low Cost Biosorbent. Orient J Phys Sciences 2018;3(2).
DOI:http://dx.doi.org/10.13005/OJPS03.02.07Copy the following to cite this URL:
Hasanin T. H. A, Ahmed S. A, Ebrahim T. B. Lead Ions Removal from Natural Water Samples by Nano-Mint Waste as Benign Low Cost Biosorbent. Orient J Phys Sciences 2018;3(2). Available from: https://bit.ly/3tFi9q7
Download article (pdf) Citation Manager Publish History
Introduction
Water pollution caused by heavy metal ions is a popular environmental problem, amongst many responsible pollutants for causing damages to the environment. Heavy metals discharged from mining and manufacturing industries. Those heavy metals are not easily biodegradable or decomposable and the exposure to it even at less concentration has highly toxic effects to many parts of human bodies and also to plants and animals.1 Among heavy metals, Pb(II) is a highly toxic substance, this metal can cause dangerous health effects for both adults and children. Kidney, liver, basic cellular processes, reproductive system and brain functions can be damaged by lead. Due to their severe toxicities, many methods developed to their treatment before discharge from industries to the environment to avoid its associated health hazards.2, 3 Moreover, we need highly selective and sensitive techniques. From past few decades some methods including liquid–liquid extraction, chemical precipitation,4 and solid phase extraction (SPE) have been cited to remove lead ions from industrial wastewater.5 SPE was considered the most efficiency technique compared with others for their simplicity and cheapness. The choice of new sorbents is necessary factor in improving analytical sensitivity, affinity, capacity and precision in SPE procedures.6 The main targets to obtain effective materials to work as an SP-extractor are as follows: they have to be rapid and quantitative sorption, they should be stable and having insoluble porous matrix contain proper active groups, typically chelating and inorganic ligands, (which can selective binding with analytes; and having active surface area with large adsorption capacity).7 However, some of sorbents are expensive, thus agricultural wastes as low-cost biomass could be used effectively for heavy metals removal.8 It has attracted considerable attention in the recent years.9 Some of them include the shells and/or stones of fruits like coconut,10 peanuts,11 walnut 12 and fruit peels as adsorbents, orange peel,13 pomelo peel,14 citrus peel waste,15 banana peel 16 and sugar cane bagasse.17 The basic components of these wastes materials include lignin, proteins, hemicellulose, lipids, simple sugars, hydrocarbons, and starch, as well as contain variety of functional groups.18 There is an increasing interest of using nano-adsorbents in water treatment.19 Their smaller size increase the surface hence increases their potential for adsorption and give their remarkable capacities to uptake wide selection of pollutants. Moreover, a variety of efficient, ecofriendly and cost-effective nano-adsorbents have been developed for potential treatment of wastewater, surface water, ground water and drinking water.20 In fact, a large variety of agricultural wastes are explored as low cost nanometer-sized adsorbents. These nano waste materials have been prepared either by physical modification or chemical binding of selected chelating agents to different solid supports for selective separation and/or preconcentration of different pollutants present in complex matrices.21 However, these synthetic modifications are usually time-consuming. In addition, most of these nano adsorbents usually prepared by using difficult and an expensive mechanical grinder to convert their nanometer-size materials .22 Hence, it has been aimed to improve a novel biosorbent with a large surface area, high uptake capacity by a simple, rapid and inexpensive method to overcome these disadvantages.
The goal of this work was to develop environmental friendly and also low cost biomass for removal of Pb(II) using NMW. It is known as natural agriculture waste contains reactive groups in its structure as shown in Fig. 1, which are responsible for metal adsorption from solutions. These natural wastes were ground to fine powder in domestic mill. Then, the particle size is reduced to nano size form which leads to increase its surface area. Hence, based on these finding, nano mint waste (NMW) with its high adsorption capacity and rapid extraction, can be used successfully as a more economic and effective biosorbent for removal of lead from aquatic medium.
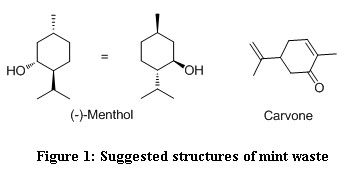 |
Figure 1: Suggested structures of mint waste |
Experimental
Chemicals
Chemicals used in this study are analytical reagent grade and used with further purification. Pb(CH3COO)2.3H2O, NaOH, HCl and Ethylenediaminetetracetic acid disodium salt, dihydrate were purchased from BDH (England), Merck and Germany. Natural water samples including ground water (GW), drinking tap water (DTW), natural drinking-water (NDW), and Nile River water (NRW) all of them were collected from Minia city, Egypt. Wastewater (WW) was taken from Abu Korkas sugar Factory, Minia, Egypt. Finally, sea water (SW) was collected from Alexandria City, Egypt.
Apparatus
Morphological characterization of NMW was obtained using scanning electron microscope (SEM) model JSM-5400 LV JEOL (Japan). The function groups of biosorbent before and after metal ion biosorption were studied using FT-IR spectrophotometer model 410 JASCO (Japan). The pH values were evaluated by Metrohm pH-meter model 691. Transmission electron microscope (TEM) model JEM100CX11 JEOL (Japan) was used for determining NMW particle size. The crystallinitiy structure of the nano biosorbent was recorded using JEOL X-ray diffract meter (XRD) model JSX-60PA (Japan). The shaking process was carried out using Gesellschaft Fur Labortechechnik (GFL) model 3018. An atomic absorption spectrophotometer (AAS) was performed with Scientific Equipment PTYLTD (GBC) Model 902 to measure the concentration of the studied metal ions.
Treatment of mint waste
The mint was purchased from the local market from Minia city, Egypt. The mint waste was collected after boiling mint at least for two times, then it was washed with double distilled water for many times, filter and air dried. The dried mint waste was ground in a mill and sieved to obtain a powdery form and remove the large particles. The powdered form was also ground and sieved another time. The final powdered material was dried well in an oven at 60 C° for 1h. Then, it was kept in a closed glass bottles and stored until utilization. The practical size of the powdered material records range from 14.7- 31.6 nm.
Batch adsorption experiments
The capacity of the nano mint waste biosorbent for uptake of the Pb(II) ions under investigation from aqueous medium was estimated using the batch equilibrium experiments. Typically, 10 mg of NMW was added to 0.5 ml of 0.1 molL-1 lead ion and completed to 50.0 ml by DDW at pH range (1–6). For the pH adjustment, 0.1 M HCl and 0.1 M NaOH solutions were used. Then, mechanically shaken for 30 minutes. After equilibration, the mixture was filtered and washed with DDW. The residual metal ion in the filtrate was then determined by complexiometric EDTA titration using xylenol orange indicator. The effect of amount of biosorbent, metal ion concentration and shaking time were tested and evaluated by the same previous method.
Results and discussion
Characterization of the biosorbent
SEM is important tool for visual confirmation of the morphological of biosorbent surface. Figure 2 shows the differences in morphologyical surface of nano mint waste before and after Pb(II) ions uptake. The surface of NMW is coarse and after forming complex with the Pb(II) showed very smooth morphologies These differences of biosorbent structure support the biosorption of the studied metal ion on NMW surface. Figure 3 indicates NMW particle size to be in the range 14.7 – 31.6 nm in TEM analysis.
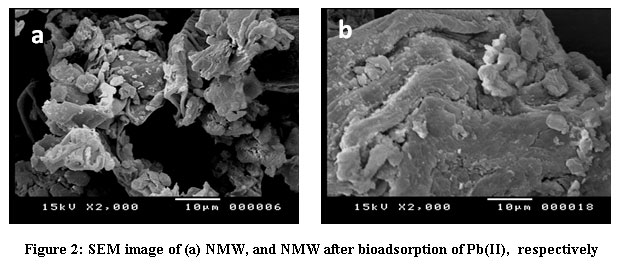 |
Figure 2: SEM image of (a) NMW, and NMW after bioadsorption of Pb(II), respectively |
X-ray diffraction (XRD) analysis of NMW was cleared in Fig. 4. The XRD pattern of NMW indicates the biosorbent is semi crystalline with high diffraction peaks existed at 26, 52°, 72°. The XRD spectra of NMW after biosorption of Pb(II) became amorphous. Mint essential oils contain more alcohol and terpene and the main compound was menthol. The chief constituent of Spearmint oil is Carvone [23]. Those reactive groups contain a lot of functional groups including C=O, C–O, and O–H that responsible for metal adsorption from solution.
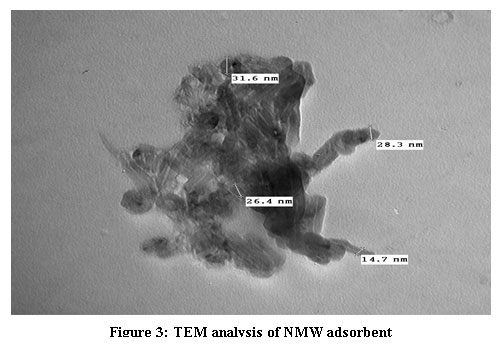 |
Figure 3: TEM analysis of NMW adsorbent |
X-ray diffraction (XRD) analysis of NMW was cleared in Fig. 4. The XRD pattern of NMW indicates the biosorbent is semi crystalline with high diffraction peaks existed at 26, 52°, 72°. The XRD spectra of NMW after biosorption of Pb(II) became amorphous. Mint essential oils contain more alcohol and terpene and the main compound was menthol. The chief constituent of Spearmint oil is Carvone [23]. Those reactive groups contain a lot of functional groups including C=O, C–O, and O–H that responsible for metal adsorption from solution.
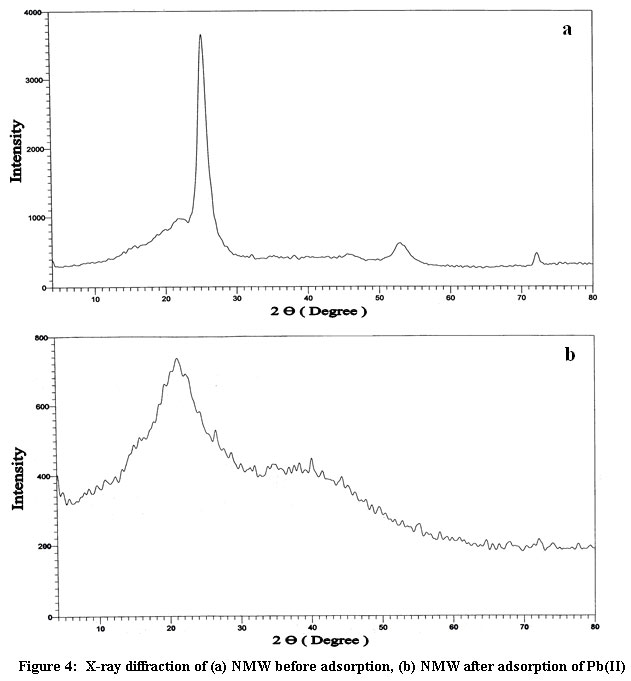 |
Figure 4: X-ray diffraction of (a) NMW before adsorption, (b) NMW after adsorption of Pb(II) |
The FT-IR spectra ranged at 4000 - 400 cm-1 of NMW before and after biosorption of metal ions were performed to measure the changes in vibration frequencies of their functional groups as shown in Fig. 5. The FT-IR spectra of NMW showed as the functional groups like O–H at 3412.18 cm-1, C–H at 2926.43 and 1321.13 cm-1, C=O stretching of carbonyl group at 1654.1cm-1, C–C which correspond to the aromatic rings at 1422.77 cm-1 and C=C ring stretch aromatic at 1544.15 cm–1. Finally, C–OH stretching of phenol, alcohols, ethers and esters 1057.86–1260.387 cm-1 functional groups were mainly present.24 The information of surface functional groups would give the premeditation of adsorption capability of NMW biosorbent. The assignment determination supports the complex nature of the observed biosorbent. From these results, it concluded that the Pb(II) ions would bind to nano mint waste natural biosorbent by interaction with the reactive groups OH of phenolic groups and the C=O of carbonyl group as well.
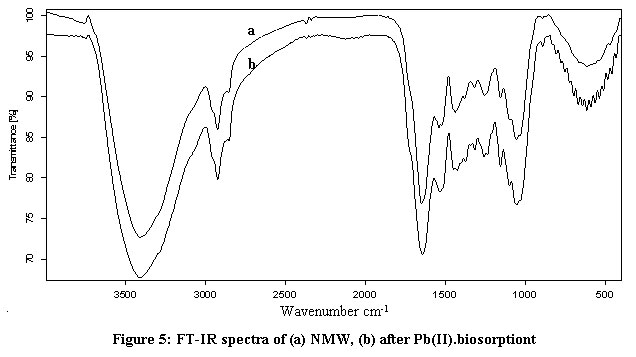 |
Figure 5: FT-IR spectra of (a) NMW, (b) after Pb(II).biosorptiont |
Concerning FT-IR for (NMW) after Pb(II) uptake, it was clear that carbonyl C=O and phenolic –OH groups were changed after uptake process. This was determined from shape or band intensity and shifts in their absorption peaks from 1057.86, 1654.10, 1544.15 and 3412.18 cm–1 to 1059.94, 1645.57, 1536.84 and 3412.80 cm–1 of ν (-C-O-), ν (-C=O-), ν (-C=C) and ν (-OH) , for nano mint waste before and after Pb(II) sorption, respectively, as shown in Table (1). Indicate the involvement of these groups in the biosorption and emphasizing a chemical interaction was happened between metal and carbonyl C=O, phenolic –OH groups onto biosorbent surface as shown in Fig. 6.
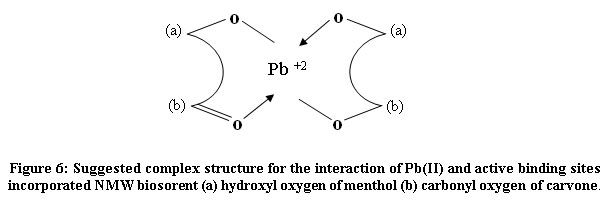 |
Figure 6: Suggested complex structure for the interaction of Pb(II) and active binding sites incorporated NMW biosorent (a) hydroxyl oxygen of menthol (b)carbonyl oxygen of carvone. |
Table (1) Fundamental FT-IR bands of NMW before and after Pb(II) biosorbtion
|
Assignment |
Band position (cm−1) |
|
|
After biosorption |
Before biosorption |
|
|
Pb(II) |
||
|
O–H stretch, H bonded, alcohol, phenol |
3412.80 |
3412.18 |
|
C–H stretching vibrations of –CH2 and –CH3 functional group |
2926.51
|
2926.43
|
|
C=O stretching of carbonyl group |
1645.57 |
1654.10 |
|
C=C ring stretch aromatic |
1536.84 |
1544.15 |
|
C–C stretch (in ring), aromatics |
1430.96 |
1422.77 |
|
C–H aliphatic –CH3 or –CH2 |
1319.82 |
1321.13 |
|
C=O stretch of carbonyl group |
1259.72 |
1260.37 |
|
C–OH stretching of phenol
|
1158.37- 1059.94 |
1158.65- 1057.86 |
Equilibration studies of nano mint waste for uptake of Pb(II) as a function of pH, biosorent dose and equilibrium time
FT- IR analysis showed that NMW has reactive functional groups (-OH, C=O) giving a chance for complex formation with the target metal ion. Furthermore, depending on the pH value of aqueous solution these function groups participate in metal ion binding. So, the pH value has an important influence on the uptake values of lead ions from by the NMW as shown in Fig. 7. At low pH value, the uptake capacity of Pb(II) was highly low owing to the competition between the H+ and the positively charged lead ions toward the same actives sites of the biosorent surface. While the uptake capacity increased with an increase in the pH in range of 1 – 6. The increase in the solution pH, less H+ ion concentrations, consequently electrostatic attraction of the lead ions increase toward the NMW negatively charged surface. Thus, pH 5.5 is a suitable pH value which develops the adsorption efficiency, and also reduces the matrix interference. On the other hand at pH values higher than 5.5, transform in M(OH) or precipitate as M(OH)2 formation [25]. Then, pH 5.5 was selected as an optimum pH value. At this value for maximum uptake of Pb(II) by NMW biosorbent determined to be 1.3 mmolg-1.
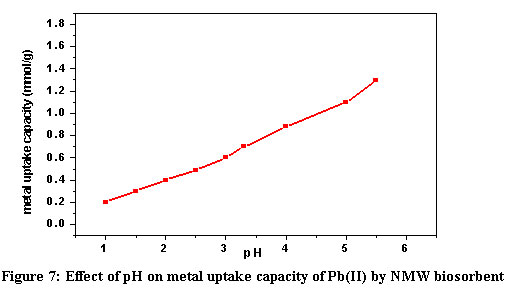 |
Figure 7: Effect of pH on metal uptake capacity of Pb(II) by NMW biosorbent |
The effect of NMW dose is an significant factor for the determination of lead uptake capacity from wastewater. Various biosorbent dose ranging from 10 to 1000 mg was added to 1ml of 0.1 molL-1 lead ion and completed to 50.0 ml by DDW keeping all the other experimental parameters, viz., pH 5.5 for Pb(II), and contact time 30 min. Figure 8 represents the biosorbent dose plot versus uptake capacity of Pb(II) adsorbed. It was clear that as the biosorbent dose increasing of 10 up to1000 mg, the metal uptake capacities of Pb(II) was decreased.
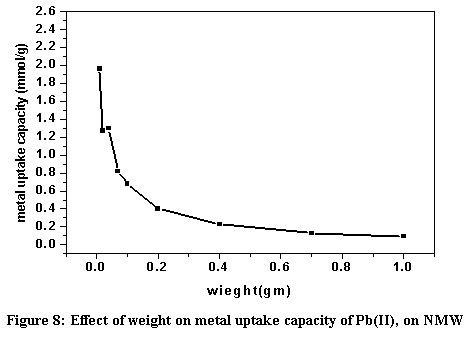 |
Figure 8: Effect of weight on metal uptake capacity of Pb(II), on NMW |
Effect of contact time was studied to estimate the maximum metal uptake capacity at an time for the biosorption of lead ions on NMW. 10 mg of biosorbent was added to 1.0 ml of 0.1 molL-1 of the metal ions; the total volume was completed to 50.0 ml at pH 5.5. Each mixture was automatically shaken for the selected period times 0.5, 1, 2, 5, 10, 20, 30, 45, 60 and 90 min. Figure 9 shows the plot of metal ions capacities on NMW virsus time. It was found that the adsorption processes were very rapid for equilibrium of lead to be attained in just 30 seconds of contact and reached a saturation level, with metal ions. This fast adsorption rates emphasized easy interaction of the available binding sites by the metal ions and time reduction. It is easy to spot that Pb(II) adsorption on the NMW is very quick. From these results, 30 seconds was selected as the equilibrium time through the batch experiments in further study.
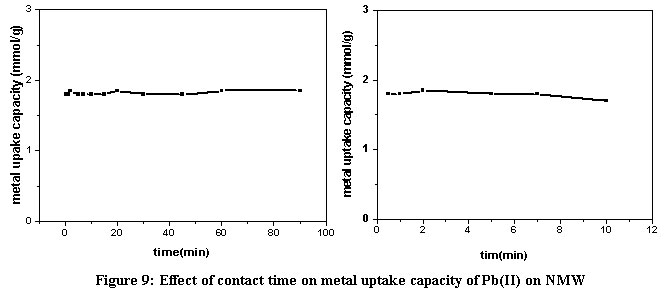 |
Figure 9: Effect of contact time on metal uptake capacity of Pb(II) on NMW |
Adsorption isotherms
The equilibrium adsorption isotherms are the promising parameters to determine the maximum metal uptake, affinity and the mechanisms of the adsorption process for supporting the highest possible performance of the biosorbent. This occurred at constant temperature by studying metal uptakes over metal ion concentration range and fitting the isotherm data to the Freundlich and Langmuir isotherm models.26
Freundlich isotherm
The basic assumption of Freundlich isotherm is that the adsorbate concentration on adsorbent surface increase with adsorbate concentration. This model is an earlier empirical equation, which consistent with exponential distribution of active centers and concludes that the adsorption process of metal ions happen on a heterogeneous surface.27 The Freundlich equation is expressed as follows:
qe = Kf . Ce1ln (exponential form)
where Kf and 1/n are the Freundlich constants attributed to adsorption capacity and intensity, respectively. Taking logs and rearranging of this relation, it can given the linear form of Freundlich model as expressed in as follows:
log qe = log Kf + 1/n log Ce (linear form)
The constants (Kf) and (1/n) can be determined by the linear plot of log qe versus log Ce. from the intercept LogKf and slope 1/n of this linear equation as shown in Fig. 10. The correlation coefficient for freundlich model was (R2=0.975) for NMW; denoting that the biosorption process can be well described by freundlich model. Furthermore, the value of "n" lies between 1 and 10 showing a high affinity between the lead ions and the biosorbent.
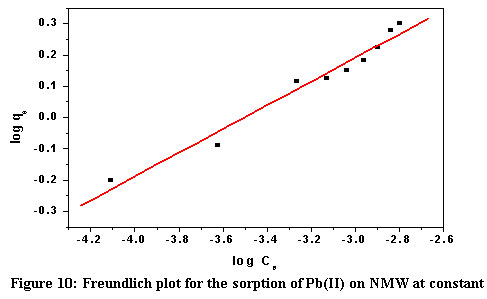 |
Figure 10: Freundlich plot for the sorption of Pb(II) on NMW at constant |
Langmuir isotherm
Langmuir isotherm is acommonly applied model for adsorption on completely homogenous surface.28 The Langmuir equation is expressed as follows:
1 / qe = 1/ qm + 1/qmbCe (linear form)
where qe (mmolg−1), Ce (mmolml−1) are the adsorption capacity and concentration at the equilibrium, qm (mmolg−1) is the maximum metal uptake capacity on Langmuir monolayer and b (mlmmol−1) is the Langmuir constant, which also depicts the sorption affinity between the sorbents and sorbates, and could be estimated from the intercept (1/qm b) and slope (1/qm) of the linear plot 1/qe vs 1/Ce. As shown in Fig. 11, the correlation coefficients R2= 0.988, confirms that the biosorption process prefect described by Langmuir model also.
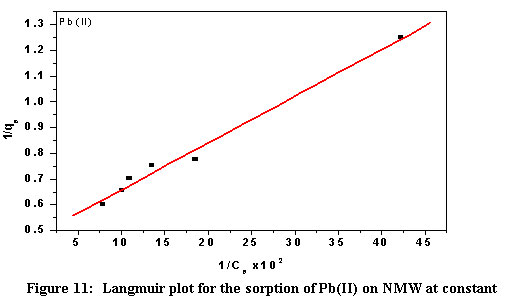 |
Figure 11: Langmuir plot for the sorption of Pb(II) on NMW at constant temperature |
The corresponding parameters of the two isotherm models obtained in the present study are listed in Table (2). The maximum Pb(II) uptakes qmax = 2.13 estimated from the Langmuir models in well agree with experimentally obtained values qe.(exp) = 2.00. These results indicated that monolayer adsorption was the probable mechanism of Pb(II) biosorption onto the NMW biosorbent and showed that the obtainable binding sites were saturated with the lead ions. Additionally, the strong affinity depicted by the Langmuir isotherm mode b = 0.026 also enables easy access to the binding sites and thus fast biosorption rate. This was probably the reason for the faster adsorption rate exhibited by NMW. These results demonstrate the potential of NMW as available biosorbent for the heavy metals removal from aqueous solutions.
Table 2: Freundlich and Langmuir isotherm constants for biosorption of Pb(II) on NMW at room temperature.
|
Langmuir model |
|
Ferundlish model |
metal |
||||||
|
|
R2 |
qmax (mmol/g) |
b |
|
R2 |
1/n |
Kf |
|
|
|
|
0.988 |
2.13 |
0.026 |
|
0.975 |
0.36 |
18.99 |
Pb(II) |
|
Kinetic Studies
Kinetic experiment provides valuable insight into reaction pathways and gives information of the rate at which an biosorbent attracts adsorbates from the liquid phase and finally achieve equilibrium. The extremely faster biosorption kinetics of NMW is in conformation to the strong affinity depicted by the Langmuir isotherm model, and this may be due to its larger surface. Progressively, adsorption of lead ions attained equilibrium fast and still stable along time change as shown in Fig. 12.
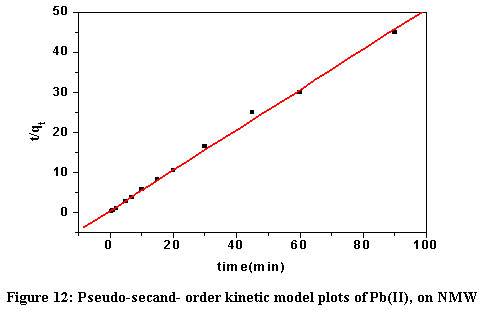 |
Figure 12: Pseudo-secand- order kinetic model plots of Pb(II), on NMW |
Moreover, due to the presence of hydroxyl group in NMW, complexation may occur between lead ion and adsorbent surface which significantly shows fast adsorption rate. Various models such as pseudo-first- and second-order kinetic equations are used to examine the controlling mechanism of adsorption process. The pseudo-first-order kinetic model known as the Lagergern equation.29
log(qe − qt ) = log qe − (k1 / 2.303) t
where qt , qe are the adsorption capacity at time t and at equilibrium (mmolg−1) and k1(min−1) is the rate constant of pseudo-first-order adsorption process, respectively. The adsorption possess do not follow pseudo-first-order. The equation of pseudo-second-order kinetic model expressed as:
t/qt=1/k2qe2+1/qet
where k2 (gmmol-1min-1) is the constant of pseudo-second order, k2 and qe can be calculated from the slope and intercept of the leaner plot of t/qt versus. The constants of kinetics models for the biosorption of lead ion on NMW are listed in Table (3). that provides the best correlation coefficient and the theoretical values of qe=2.00 also agree with the experimental values qe.exp=2.00, which exhibit that the adsorption satisfy with the pseudo-second-order mechanism and the adsorptions rate is controlled by chemical adsorption and the chemical adsorption is the rate limiting step. Thus, the reaction mechanism may be a result of the ion exchange between Pb(II) and the hydroxyl groups on the nano mint surface.
Table 3: Pseudo-second order rate constants and equilibrium metal uptake for Pb(II) binding onto nano mint waste.
|
|
Second-order kinetic |
Metals |
|||
|
R2 |
K ads |
qe theoretical (mmol/g) |
qe Experimental. (mmol/g) |
|
|
|
0.999 |
0.346 |
2.0 |
2.0 |
Pb(II) |
|
Comparison with various low cost natural biosorbents
Comparison of adsorption results of NMW biosorbent with different natural biosorbents published recently for determination of Pb(II) are summarized in Table (4). This clearly indicated that NMW has higher metal uptake capacity for Pb(II) as compared to data reported for other natural biosorbent. Presented data showed high adsorptive capacity with large adsorptive surface area of the NMW for the uptake of lead. Furthermore, NMW biosorbent is simple, inexpensive and prepared by rapid method without modification therefore there is no consuming of solvent and time so this method considered friendly to environment.
Table 4: Comparison of NMW with various recent adsorbent for removal of Pb(II) from water.
|
Metal |
Adsorbent |
Adsorption capacity (mgg-1) |
Contact time(min) |
PH |
Adsorbent dose (g/l) |
Simplicity of sorbent synthesis |
Ref. |
||
|
Synthesis steps |
Time needed for synthesis(h) |
Solvent use for synthesis |
|||||||
|
Pb(II) |
Modified walnut shell |
28.5 |
4 min |
5 |
2 |
Multisteps |
>20 h |
NaOH |
[12] |
|
|
Tripolyphosphate modified waste lyocell fiber |
305 ± 4.7 |
- |
5 |
1 |
Multisteps |
24 h |
Dimethyl formamide (DMF) |
[30] |
|
|
Modified rice husk |
93.4 |
90 min |
5 |
5 |
Multisteps |
24 h |
Ethanol + tetrahydrofuran (THF) |
[20] |
|
|
Chemically modified lycell fiber |
531.2±0.28 |
5 min |
5 |
1 |
Multisteps |
>1.5 h |
NaOH + acetone |
[31] |
|
|
Xanthate modified apple pomace |
178.5 |
5 min |
4 |
0.8 |
Multisteps |
>12 h |
NaOH
|
[32] |
|
|
Chemical treated olive stone |
16.2 |
- |
5 |
10 |
One step |
24 h |
NaOH |
[33] |
|
|
Treated gave bagasse |
50.1 |
- |
5 |
1 |
Multisteps |
12 h |
NaOH |
[34] |
|
|
Sulfured orange peel |
164 |
- |
5 |
5 |
Multisteps |
>24 h
|
NaOH + ethanol
|
[35] |
|
|
Nano mint waste |
441.3 |
30 sec |
5.5 |
0.2 |
bare NMW |
- |
solventless |
The proposed |
Applications
The applicability of the this method were tested for Pb(II) removal on biosorbent by spiking a known amount (10.0 ppm) of Pb(II) in different environmental water samples (DTW, NDW, NRW, GW, WW, SW). The optimized conditions were applied to the real water sample in batch mode, (pH 5.5, dose of biosorbent in range of 0.01 g and 1.0 g and contact time 30 seconds). As cleared in Table 5, these results emphasized that the high recoveries (≥ 98% removal Pb (II) in all collected samples) of spiked samples obtained by atomic absorption spectrometry (AAS). Thus supporting the accuracies and the validity of the procedure for the evaluation of Pb(II) in water samples and ignoring the matrix effects.
Table 5: Removal percentage of amounts of Pb(II) spiked different real water samples with NMW. Recovery a (%)
|
Metal |
Water sample |
Spiked (ppm) |
Mass of the adsorbent (g) |
Recovery a (%) |
|
Pb(II) |
TW1 |
10 |
0.01 |
99 ± 1 |
|
|
TW2 |
10 |
0.01 |
99 ± 1 |
|
|
DW |
10 |
0.01 |
99 ± 1 |
|
|
GW1 |
10 |
0.05 |
99 ± 1 |
|
|
GW2 |
10 |
0.01 |
99 ± 1 |
|
|
RW |
10 |
0.01 |
99 ± 1 |
|
|
SW |
10 |
1.00 |
98 ± 1 |
|
|
WW |
10 |
1.00 |
98 ± 1 |
a average of three determination ± standard deviation (S.D.)
Conclusion
In this work, the removal of lead ions from real water samples was carried out by treatment with NMW biosorbent under optimized conditions of different parameters these include pH, contact time, adsorbent dosage and concentration of metal ion. Adsorption process is extremely fast with 30 seconds of contact between adsorbent and adsorbate. The equilibrium data were fitted well with both the Langmuir and Frendllich models, while the appropriate kinetic model for fitting the experimental data was a pseudo-order. NMW biosorbent showed high affinity and high capacity for removal of Pb(II) comparing with other sorbents reported recently in the literature.
References
- K. M. Al-Qahtani, J. of Taibah University for Sci. 10 (2016) 700–708.
- M. Basu, A. K. Guha, J. of Cleaner Production 151 (2017) 603 - 615.
- R. Sudha, P. Premkumar, International J. of Chem. Tech. Research 9 (2016) 47-57.
- Z. D. Firouzabadi, A. M. H. Shabani, S. Dadfarnia, M. H. Ehrampoush, Microchemical J. 130 (2017) 428 – 435.
- B. Srivastava, M. K. Barman, M. Chatterjee, D. Roy, B. Mandal, J. of Chromatography A, 1451 (2016) 1–14.
- Renu, M. Agarwal, K. Singh, S. Upadhyaya, R. K. Dohare, Materials Today: Proceedings 4 (2017) 10534–10538.
- S. D. Gisi, G. Lofrano, M. Grassi, M. Notarnicola, Sustainable Materials and Technologies 9 (2016) 10–40.
- N. M. Noor, R. Othman, N.M. Mubarak, E. C. Abdullah, J. of the Taiwan Institute of Chem. Eng. 78 (2017) 168–177.
- M. J. Rwiza, S.-Y. Oh, K.-W. Kim, S. D. Kim, Chemosphere 195 (2018) 135-145.
- R. Malik, S. Dahiya, S.lata, International J. of Biological Macromolecules 98 (2017) 139–149
- L. Rozumová, O. Životský, J.Seidlerová, O. Motykaa, I. ŠafaÅ™íkd, M. ŠafaÅ™ íkovád, J. of Environ. Chem. Eng. 4 (2016) 549–555.
- A. Safinejad, M. Arab Chamjangali, N. Goudarzi, G. Bagherian, Bagherian, J. of Environ. Chem. Eng. 5 (2017) 1429–1437.
- L. A. Romero-Cano, L. V. Gonzalez-Gutierrez, L. A. Baldenegro-Perez, Industrial Crops and Products 84 (2016) 344–349
- P. Tasaso, J. of Clean Energy Technologies, 2 ( 2014) 154-157.
- H. N. Bhatti, Q.Zaman, A.Kausar, S. Noreen, M. Iqbal, Ecological Engineering 95 (2016) 216-228.
- A. Ali, K. Saeed, F. Mabood, Alexandria Eng. J. 55 (2016) 2933–2942.
- M. P. Tavlieva, S. D. Genieva, V. G. Georgieva, L. T. Vlaev, J. of Molecular Liquids 211 (2015) 938–947.
- L. D. Hafshejani, A. Hooshmand, A. A. Naseria, A. S. Mohammadia, F. Abbasib, A. Bhatnagarc, Ecological Engineering 95 (2016) 101–111.
- M. Anjum, R. Miandad, M. Waqas, F. Gehany, M.A. Barakat, Arabian J. of Chem. (2016) http://dx.doi.org/ 10.1016/j.arabjc.2016.10.004.
- A. Masoumi, K. Hemmati, M. Ghaemy, Chemosphere 146 (2016) 253-262.
- E. Heraldya, W. W. Lestaria, D. Permatasaria, D. D. Arimurtia, J. of Environ. Chem. Eng. 6 (2018) 1201–1208.
- S.-H. Hoa, S. Zhua, J.-S. Changa, Bioresource Technology 246 (2017) 123–134.
- S. Pap, J. Radoni, S. Trifunovi, D. Adamovi, I. Mihajlovi, M. V. Miloradov, Ma. Tur. Sekuli, J. of Environ. Management 184 (2016) 297-306.
- S. Ben-Ali, I. Jaouali, S. Souissi-Najar, A.Ouederni, J.of Cleaner Production 142 (2017) 3809-3821.
- J. K. Bediako, W. Wei, Y.-S. Yun, J. of Industrial and Eng. Chem. 43 (2016) 61–68.
- A. DÄ…browski, Adv colloid interface Sci. 93 (2001)135–224.
- K.Y. Foo, B.H. Hameed, Chem. Eng, J. 156 (2010) 2–10.
- U. Maheshwari, B. Mathesan, S. Gupta, Process Safety and Environmental Protection 98 (2015) 198–210.
- Ko. G. Akpomie, F. A. Dawodu, K. O. Adebowale, Alexandria Eng. J. (2015) 54, 757–767.
- J. K. Bediako, D. H. K.Reddy, M.-H. Song, W. Wei, S. Lin, Y.-S. Yun, J. of Envirn. Chem. Eng. 5 (2017) 412–421.
- J. K. Bediako, W. Wei, Sok Kim, Y.-S. Yun, J. of Hazardous Mater. 299 (2015) 550–561.
- P. Chand, A. Bafana, Y. B. Pakade, International Biodeterioration & Biodegradation 97 (2015) 60-66.
- G. Bla´zquez , M. Calero, A. Ronda, G. Tenorio, M.A. Martı´n-Lara, J. of Industrial and Eng. Chem. 20 (2014) 2754–2760.
- L. H. Velazquez-Jimenez, A. Pavlick, J. R. Rangel-Mendez, Industrial Crops and Products 43 (2013) 200– 206.
- S. Liang, X. Guo, Q. Tian, Desalination 275 (2011) 212 – 216.

This work is licensed under a Creative Commons Attribution 4.0 International License.