Hydrocarbon Potential and Performance Evaluation of Oil Wells from Reservoir Petrophysical Properties
Udo Kufre Israel1*  , Adizua Okechukwu Frank2 and Azuoko George-Best3
1Department of Physics, Faculty of Physical Sciences, University of Uyo, Uyo, Akwa Ibom State Nigeria .
2Geophysics Research Group – GRG, Department of Physics, Faculty of Science, University of Port Harcourt, Port Harcourt, Rivers State Nigeria .
3Department of Geology/Geophysics, Faculty of Science, Alex Ekwueme Federal University, Ndufu Alike, Ebonyi State Nigeria .
http://dx.doi.org/10.13005/OJPS10.02.02
Petro physical parameters from hydrocarbon producing wells have been derived and interpreted to predict the production capacity and performance of the wells. Porosity, permeability, water saturation, reservoir thickness and shale volume were the reservoirs parameters calculated for each hydrocarbon bearing zone delineated from the two wells (W1 and W2) in the Niger Delta oil field. Twelve reservoirs were delineated, correlated and ranked using average results of the derived petrophysical parameters. The averages of estimated petrophysical properties were found to be 20.14% porosity, 1643.65mD permeability and 63.20% hydrocarbon saturation for W1 and 15.55% porosity, 1582.58mD permeability and 61.93% hydrocarbon saturation for W2. Recoverable oil reserve was 148.45MMBB for W1 and 145.91MMBB for W2. From these results, it was deduced that W1 would be more productive than W2 in terms of oil accumulation.
Copy the following to cite this article:
Udo, K. I., Adizua, O. F., Azuoko, G-B. Hydrocarbon Potential and Performance Evaluation of Oil Wells from Reservoir Petrophysical Properties. Oriental Jornal of Physical Sciences 2025; 10(2).
DOI:http://dx.doi.org/10.13005/OJPS10.02.02Copy the following to cite this URL:
Udo, K. I., Adizua, O. F., Azuoko, G-B. Hydrocarbon Potential and Performance Evaluation of Oil Wells from Reservoir Petrophysical Properties. Oriental Jornal of Physical Sciences 2025; 10(2).
Download article (pdf) Citation Manager Publish History


Introduction
Petroleum reserves are the amounts of hydrocarbons found inside the Earth’s crust. When assessing resources, the main aim is to find out how much can be extracted and sold, but resource evaluations focus on what can be found and put to use by the industry. A petroleum resource management system provides a consistent method for recording petroleum volumes, analyzing prospects for development and displaying the results in a formal structure. Every hydrocarbon that has been produced and held underground before any mining is part of the total oil and gas resource base. A large part of today’s petroleum is beyond the reach of known or anticipated technology. Both recoverable and non-recoverable minerals are often very hard to extract because they are so spread out in the Earth’s crust—using mining or energy-demanding techniques such methods do not produce more energy than they require. Because of technological barriers, economic issues or other physical complications, some hydrocarbons that exist in profitable quantities cannot be retrieved, despite efforts to do so.
In the petroleum industry, accurately predicting reserves is very important according to.1 As a part of this process, engineers count how much hydrocarbons can be economically extracted from a certain region. Professionals use the material balance method, the volumetric method and the performance method to estimate reserves. Geological models are developed in the volumetric method by using data taken from drilled wells and seismic surveys. The analysis of well logs leads to the calculation of porosity, water saturation and net hydrocarbon thickness. Seismic information allows geologists to picture the subsurface area and measure the amount of each reservoir. By reading data from fluid samples such as reservoir pressure, fluid volumes and temperature, we estimate how the oil and gas will change between its deep underground condition and conditions above the surface. Results from the data are put into standard calculations to determine the amount of hydrocarbons present. Next, using recovery factor equations, both the valued reserves and the probable reserves are estimated. Volumetric methods are often applied, but how well they measure is affected by the environment and the quantity and quality of accessible information. One should compare photo-interpreted oil volumes with actual production data early on in development. With the performance method, reserves are predicted using both mathematical models and graphical plots, mainly by means of production decline curve analysis and material balance. Typically, the petroleum industry uses these techniques to assess and predict outcomes for a single well, a whole reservoir or an entire production field. When production and pressure data are collected from a field, reserves are most often estimated through decline curve analysis and by applying material balance. In addition, they should be used selectively when a field’s resources first begin to be used up.
Carrying out decline curve analysis calls for an extensive amount of constant production data. Stable bottom-hole pressures are required for more reliable results. Unlike coiled tubing methods, gas wells often get uneven back-pressure changes, causing changes in how much they produce which lowers their dependability. It is a plot of production against time, created on semi-log paper, so both axes are not the same. If the data are found on a straight line, it means there is a constant cut to the amount of production. An upward bend means the curve follows a hyperbolic decline, while harmonic decline is a form of this. Many in the industry use decline curve analysis as a key tool for forecasting output. They estimate what fluids can be taken out of the reservoir by closely studying pressure fluctuations during the process. Schilthuis introduced the basic material balance equation in 1939 which regards the reservoir as a tank and helps reservoir engineers learn valuable details. The equation balances oil and gas expansion, connate water expansion, changes in pore volume, water and gas injection and water influx, all of which make up the total fluids produced. There is some uncertainty about estimates derived using this method. If only a single "best guess" is possible with the supplied geological, engineering and economic data, the method is known as deterministic. By contrast, if a range and the potential probabilities are found from the same data, this process is called the probabilistic approach.2
Oil or gas content in reservoir rock is controlled by its porosity and the proportion of hydrocarbons it holds. In addition to assessing hydrocarbons, the thickness and area of the reservoir must also be known to evaluate the commercial potential of the block. The performance of hydrocarbon reservoirs also depends on petrophysical features, including lithology, porosity, water saturation, permeability and density. Although seismic sections are useful for locating hydrocarbon accumulations, better results come from examining petrophysical data from the field. In this process, we concentrate on detecting porous and permeable layers, finding out their thickness, how widely they spread laterally and their shape. Petrophysics is the branch that studies how rock properties and their relationships with fluids give rise to formation evaluation.3 To do this, engineers examine the data from boreholes to check the physical characteristics of the underlying ground.4 The majority of today’s oil and gas comes from reservoir rocks, depending on the geological history and these are filled with pores. It is by the interaction between the pore spaces and the pore throats that we determine the hydrocarbon saturation in a reservoir. Estimating how much oil or gas is in the reservoir requires knowing its thickness, the percentage of pore space it has and its size.5 A few studies have been carried out within the Niger Delta basin around the subject theme of the present study. Ihianle et al., (2013)5 investigated reservoir quality from well log and seismic data from “X-Y” field in the onshore Niger Delta basin. Salami et al., (2018)6 also investigated the hydrocarbon potential of Baze field in the onshore Niger Delta basin. Beyond the Niger Delta sedimentary basin, Farzaneh et al, (2025)7 investigated hydrocarbon potentials in the Zagros fold thrust belt in Iran and Similarly, Saffari and Kianoush (2025)8 integrated petrophysical properties in estimating hydrocarbon potential and reservoir characterization in the Zagros area of Iran.
Geology of Study Area
In a report by Tuttle et al., (1999)9, the Niger Delta Basin sits along the passive continental margin in the Gulf of Guinea, west of Nigeria and formed from vertical actions known as extensional tectonic processes. It covers the whole Niger Delta as mapped out by10. Starting in the Eocene, the delta moved southward and this led to the development of several depobelts showing where the delta changed most during its history,11 with an area of about 300,000 square kilometers and 500,000 cubic kilometers of sediment built up, these depositional basins form one of the most extensive seaward-building delta systems worldwide.12,13,14 All the petroleum activity in the province is based on the Tertiary Niger Delta (Akata–Agbada) petroleum system, as first described in15,12,16. The USGS discovered that the Niger Delta is ranked number twelve in the world for the richest petroleum resources, with 2.2% of the total discovered oil and 1.4% of the discovered natural gas.17 Specific study wells are found at 5° 57' 37.8259" N, 5° 40' 37.2805" E and 5° 58' 5.6227" N, 5° 40' 36.1624" E in the southern area of the Niger Delta. The study site is located in Ovade, Oghara, part of the Ethiope West Local Government Area of Delta State (see Figure 1).
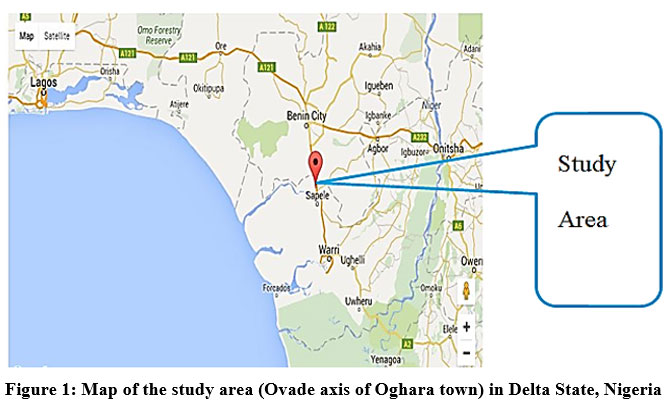 | Figure 1: Map of the study area (Ovade axis of Oghara town) in Delta State, Nigeria |
The stratigraphic column of the study area is the same with the general stratigraphy of the Niger Delta sedimentary basin. This could be studied or probed further from the literatures cited above. Figure 2 gives a stratigraphic column of the study area and by extension the Niger Delta basin after the works of Doust and Omatsola (1990)18.
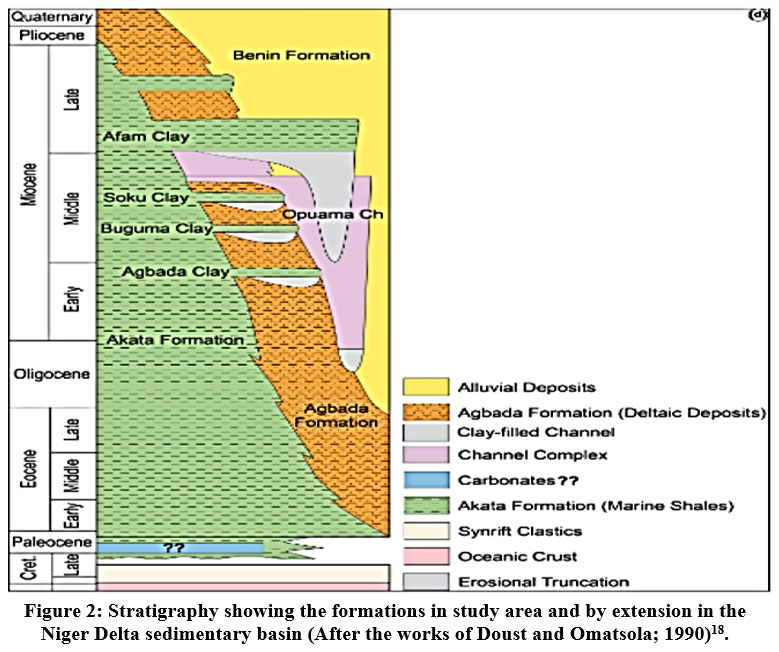 | Figure 2: Stratigraphy showing the formations in study area and by extension in the Niger Delta sedimentary basin (After the works of Doust and Omatsola; 1990)18. |
Materials and Methods
The materials used for the study comprised of suites of logs from two (2) wells, these logs include; the gamma ray, density, spontaneous potential and resistivity logs. These logs were analyzed with Schlumberger Petrel petrophysical and analysis tool and MS Excel programs to study the well performance of the reservoirs in the field. The empirical relations (methods) used in the computation of all reservoir properties are presented below.
Methods: Calculation of Petrophysical Parameters
Shale Volume (
Using the gamma ray log, shale volume was worked out by first determining the gamma ray index. Since, as reported by Larionov19, the Niger Delta comprises Tertiary rocks, the calculation of shale volume was carried out with the equation for Tertiary formations. The Niger Delta petroleum systems are found in typical sandstone reservoirs which are of Tertiary age from chronological studies, therefore, the Larionov model19 for shale estimation which applies to Tertiary aged rocks became the best approximation for our study.
![]()
where Vsh is the shale volume.
Total Porosity
Total porosity was calculated from density porosity log using the equation:
![]()
where Pma
Effective Porosity
Most of the time, effective porosity is calculated by adjusting total porosity for the estimated shale volume (content).
![]()
where
The guide for classifying porosity is shown in Table 1:
Table 1: Classification of porosity values to Baker21
Porosity value | Classification |
0 < 0.05 | Negligible |
0.05 < 0 < 0.1 | Poor |
1.0 < 0 < 0.15 | Fair |
0.15 < 0 < 0.25 | Good |
0.25 < 0 < 0.3 | Very Good |
0 >0.3 | Excellent |
Water and Hydrocarbon Saturation
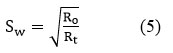
The water saturation Sw
![]()
Recalling that F=R0/Rw
Alternatively,
Water saturation can be written as:
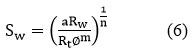
where n = saturation exponent taken as 2 and a = tortuosity.
Hydrocarbon saturation Sh
Sh = (100 - Sw )%
![]()
Permeability and Irreducible Water Saturation
The permeability was calculated from the equation:
where Swirr
Irreducible water saturation is also known as critical water saturation which defines the maximum water saturation that a formation with a given permeability and porosity can retain without producing water.
where F = formation factor and
![]()
Reserve Estimation
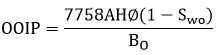
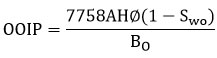
The volumetric method for estimating reserves was utilized in this work. This method calculates the amount of oil in place (Nt).
![]()
Vb = Bulk reservoir volume, RB.
RB = 758Ah
where 7758 is a constant, conversion factor from acre-ft to barrel.
![]()
S_0(t) =average Oil saturation fraction
Recall however that, S0(t) = 1 - Swo

In equation 13, A =
The concise processing workflow adopted in the comprehensive reservoir performance evaluation study is summarized in Figure 3 below;
.jpg) | Figure 3: Research methodology summarized in a detailed processing workflow.
|
Results
Having satisfactorily analyzed the available data from the wells to map horizons, delineate lithologies (sandstone and shale) as well as estimate relevant petrophysical properties (porosity, permeability, shale volume, water and hydrocarbon saturation and net-to-gross ratio), the results are hereby presented. Figure 4 shows a plot of variations in hydrocarbon reservoir properties for wells 1 and 2 in terms of net pay thickness, volume of shale, water and hydrocarbon saturation and porosity.
Hydrocarbon Potentials of Wells W1 And W2
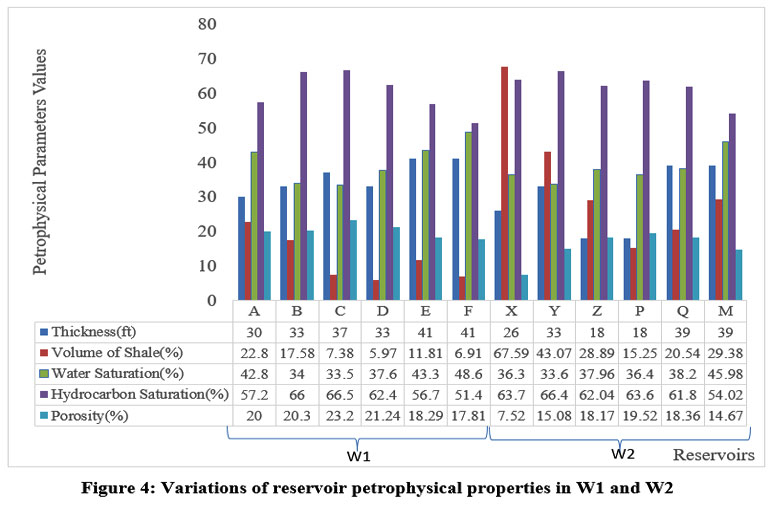 | Figure 4: Variations of reservoir petrophysical properties in W1 and W2
|
Figure 5 depicts a graphical plot of total porosity versus depth for W1 while Figure 6 shows a graphical representation of effective porosity versus depth for W1.
 | Figure 5: A plot of Total Porosity versus Depth for W1
|
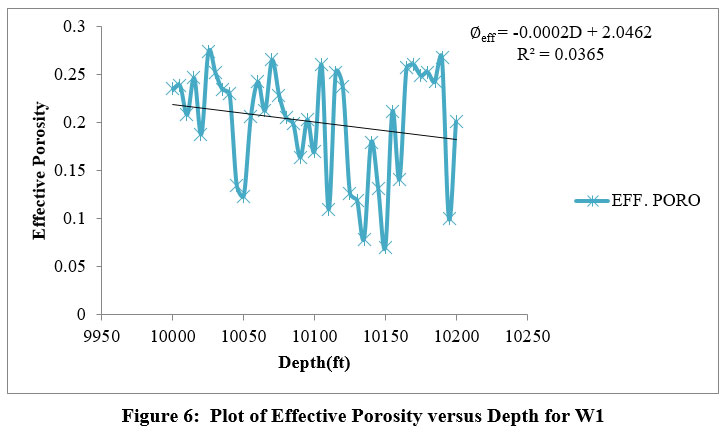 | Figure 6: Plot of Effective Porosity versus Depth for W1
|
Figure 7 is a graphical plot of total porosity versus depth for W2 while Figure 8 shows the graphical plot of effective porosity versus depth for W2.
 | Figure 7: A plot of Total Porosity versus Depth for W2
|
 | Figure 8: A plot of Effective Porosity versus Depth for W2
|
Figure 9 represents a graphical plot for permeability versus depth plot for W1 while Figure 10 is the plot of the same petrophysical parameter as a function of depth also for W2.
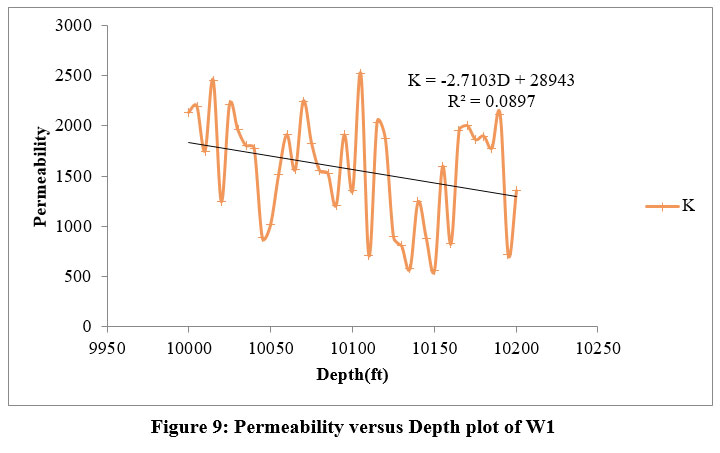 | Figure 9: Permeability versus Depth plot of W1
|
 | Figure 10: Permeability versus Depth plot of W2
|
Figures 11 and 12 are compound graphical plots for all reservoir properties estimated versus depth for well 1 (W1) and well 2 (W2) respectively.
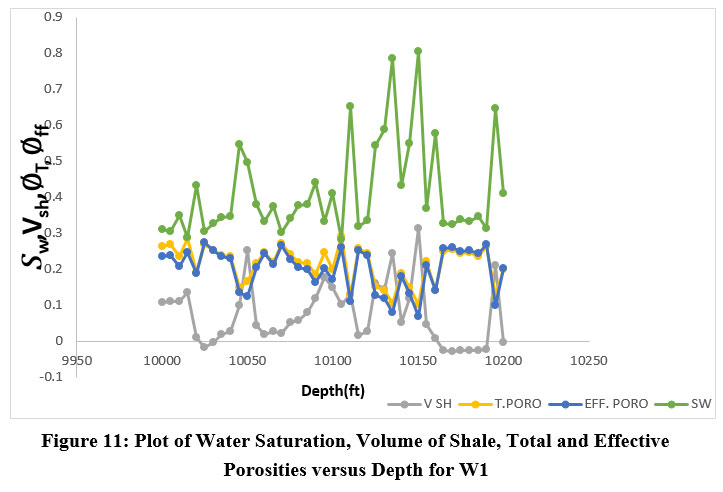 | Figure 11: Plot of Water Saturation, Volume of Shale, Total and Effective Porosities versus Depth for W1
|
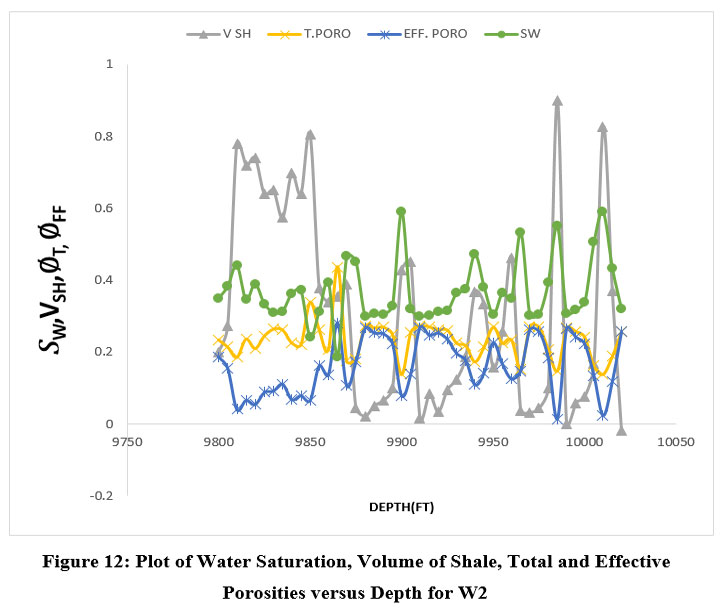 | Figure 12: Plot of Water Saturation, Volume of Shale, Total and Effective Porosities versus Depth for W2
|
A block table (Table 2) gives a summary of average petrophysical properties for Wells 1 and 2. These parameters would aid in the subsequent oil reserve computations which will be presented in the next discussion of results section.
Table 2: Summary of Average Petrophysical Properties of W1 and W2
WELLS | NTG | (%) | (%) | (%) | (API) | (API) | (mD) | (%) | OWC | STOOIP |
W1 | 85.6 | 12.1 | 36.80 | 63.20 | 3.29 | 163.97 | 1634.65 | 20.14 | 10016.75 | |
W2 | 69.5 | 34.12 | 38.07 | 61.93 | 8.76 | 259.1 | 1582.58 | 15.55 | 9964 |
Discussion
We have satisfactorily processed and analyzed the available well datasets to map horizons, delineate lithologies (principally sandstones and shale) and as well to estimate relevant petrophysical properties namely; porosity, permeability, shale volume, water saturation, hydrocarbon saturation and net-to-gross ratio. As observed in figures 4 – 8, Porosities decreases as the depth increases except effective porosity for W2 (Figure 8) in which porosity increases as depth increases as a result of low compaction or more non-interconnected pores spaces in the well. Figure 5 show the distribution of fine interconnected pores in well 1 and the purple band on the map represent the few non-interconnected pores. The yellow band on figure 7 indicates non-interconnected pore spaces. From the result, well 1 is more porous than well 2; therefore a correspondingly high permeability is expected. This expectation is consistent with the results obtained from our study as average permeability for W1 was 1634.65mD while that of W2 was 1582.58mD which represents a significant increase.
Permeability depends on porosity (increase in porosity increases permeability). The trend lines in Figure 9 and Figure 10 show the decrease in permeability as depth increase but Well 1(Figure 9) is sloppier than that of Well 2 (Figure 10) meaning Well 1 is with a higher permeability than Well 2 as reported in Table 1. Both wells have excellent permeability which is a property of highly prolific reservoirs. Variation of volume of shale in Well 1(Figure 11) is more discrete (disperse) than that of Well 2 but manages to have a trend showing a slight decrease in volume of shale as depth increases and almost parallel to the depth axis. Well 2 shows a steeper slope than Well 1, where the trend line decreases from top left to down right with a maximum value at about 9990ft. Well 2 contains more shale than Well 1 at a deeper depth, hence Well 2 is less hydrocarbon productive. Hydrocarbon saturation is dependent on water saturation (Equation 7). Less water saturating a formation increases the percentage of hydrocarbon saturating the same formation. Water saturation increases with depth (Figure 11 and Figure 12). From the following, it is inferred that well 1 is more concentrated with hydrocarbon than Well 2 as their respective hydrocarbon saturations is stated on Table 2. The reservoir quality is similar to other reservoir systems reported by Ihianle et al., (2013)5 in “X-Y” field of Niger Delta and Salami et al., (2018)6 in Baze field, Onshore Niger Delta basin. The results obtained have shown that the reservoir systems within the field are very good for exploitation and this will inform the engineering teams to carry out their detailed engineering prognosis based on the finding of the present study.
Oil Reserve Estimation
The estimation method used for this study is volumetric estimation of reserve. This volumetric estimation of hydrocarbon reserves involves the integration of various petrophysical data. Petrophysical parameters such as porosity, water saturation and hydrocarbon saturation have already been calculated.
Estimating Oil Reserve for Well 1
For W1
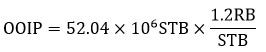
Stock Tank Original Oil in Place, STOOIP = 52.04 ×10⁶ STB
= 52.04 ×106 × 6.29
= 329.59 × 10⁶ BBL
= 329.59MMBBL
where 1 STB (m3) = 6.29 BBL (conversion factor from STB to BBL)
Original Oil in Place, OOIP = STOOIP × Bo
Given Bo
From equation 13
From Table 2 0 = 0.2014, Sh = 0.603 and h1=215ft
= 5.0029 × 10⁵ m3
0.0283168 m3/ft3
V1 = 1.766 × 107 ft3
Oil recovery factor (RF) = 45% = 0.45 as given by Shell Petroleum Development Company.
Oil Reserve = STOOIP × RF
Oil Reserve = 329.59MMBBL × 0.45
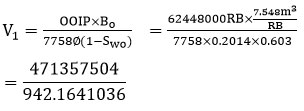
Estimating Oil Reserve for W 2
STOOIP of well 2 is =51.55 ×10⁶STB
= 51.55 × 106 STB × 6.29
= 324.25 × 106
= 324.25MMBBL
Where 1 STB (m3) = 6.29 BBL (conversion factor from STB to BBL)

OOIP = STOOIP × Bo
Given Bo
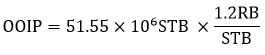
OOIP = 61860000RB = 61.86MMB
From equation 13
From Table 2, 0 = 0.1555, Sh = 0.6193 and h2 =173ft
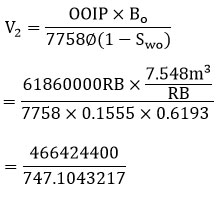
V2 = 624309.5997 = 6.24 ×10⁵ m3
V2 = 6.24 × 10⁵ m3 ÷ 0.0283168 m3/ft3
V = 2.2 × 107 ft3
Oil recovery factor (RF) = 45% = 0.45 as given by Shell Petroleum Development Company.
Oil Reserve = STOOIP × RF
Oil Reserve = 324.25MMBBL × 0.45
Conclusion
Petrophysical parameters from producing wells have been derived and interpreted to predict the production capacity and performance of the wells. Porosity, permeability, water saturation, reservoir thickness and shale volume were the reservoirs parameters computed for each hydrocarbon bearing zone delineated from the two wells (W1 and W2) in the Niger Delta oil field. Twelve reservoirs were identified, correlated and ranked using average findings of the derived petrophysical parameters. Estimated petrophysical characteristics for W1 and W2 were determined to be, on average, 20.14% porosity, 1643.65mD permeability, and 63.20% and 15.55% porosity, 1582.58mD permeability, and 61.93% hydrocarbon saturation, respectively. For W1 and W2, the recoverable oil reserves were 148.45MMBB and 145.91MMBB, respectively. It was concluded from these findings that W1 would produce more oil buildup (accumulation) than W2. This study has quantitatively revealed reservoir petrophysical parameters for wells W1 and W2 in the investigated field. The petrophysical parameters so obtained are consistent with those of previous studies within the Niger Delta sedimentary basin and also advances knowledge in the categorization of the Niger Delta petroleum system as a prolific petroleum system whose potentials have not yet been fully tapped nor exploited.
Acknowledgement
The authors acknowledge Shell Petroleum Development Company of Nigeria (SPDC) for the provision of research data used for prosecuting this study. The affiliate institutions of the authors are acknowledged for providing research and teaching platforms.
Funding Sources
The author(s) received no financial support for the research, authorship, and/or publication of this article.
Conflict of Interest
The author(s) do not have any conflict of interest.
Data Availability Statement
This statement does not apply to this article.
Ethics Statement
This research did not involve human participants, animal subjects, or any material that requires ethical approval.
Informed Consent Statement
This study did not involve human participants, and therefore, informed consent was not required.
Permission to Reproduce Material from Other Sources
If there is no statement, the following will be written: Not Applicable
Authors Contributions
UDO, Kufre Israel: conceptualized the work, sourced research data, designed methodology, analyzed the data and wrote the first original draft of the manuscript.
ADIZUA, Okechukwu Frank: contributed to research data collection, formal analysis of results and discussions and post first draft writing reviews, editing and final proofreading.
AZUOKO, George-Best: contributed to data collection and data analysis.
References
- Demirmen F. Reserves estimation: the challenge for the industry. Journal of Petroleum Technology. 2000: 52(7):80-87
- Jürgen, S. Basic Well Logging and Formation Evaluation.1st Edition, 2015:26-27
- Tiabb, D. and Donaldson, E.C. Petrophysics. Oxford: Elsevier Publishers. 2004:p215
- Helander, D.P. Fundamentals of formation evaluation. OGCI Publications, Tulsa, Oklahoma. 1983:p.6
- Ihianle, O.E., Alile, O.M., Azi, S.O., Airen, J.O., Osuoji, O.U. Three dimensional seismic/well logs and structural interpretation over ‘X-Y’ field in the Niger Delta area of Nigeria. Sci Technol. 2013:3(2):47–54.
- Salami, M.K., Amuni, A., Adewumi, T., Asare, J., O.K. Oyewole, “Hydrocarbon Potential of Baze Field, Onshore Niger Delta Nigeria: Petrophysical analysis and structural mapping.” Journal of Geoscience and Geomatics, Vol. 6, no. 2, pp.55-64, 2018
- Farzaneh, M., Maleki, Z., Arian, M., Ganjavian, M.A. & Kianoush, P. Investigating hydrocarbon potential utilizing isopach maps in the paleo-environment of the external Fars region, Zagros fold-thrust belt. Solid Earth Sciences 10 (2), 100242. https://doi.org/10.1016/j.sesci.2025.100242 (2025).
CrossRef - Saffari, M. & Kianoush, P. Integrated petrophysical evaluation of Sarvak, Gadvan, and Fahliyan formations in the Zagros Area: insights into reservoir characterization and hydrocarbon potential. Journal of Petroleum Exploration and Production Technology 15 (3), 54. https://doi.org/10.1007/s13202-025-01953-5 (2025)
CrossRef - Tuttle, M.L.W., Charpentier, R.R., Brownfield, M.E. Tertiary Niger Delta (Akata-Agbada). Petroleum System. 1999:3-5
- Klett, T.R., Ahlbrandt, T.S., Schmoker, J.W., Dolton, J. L. Ranking of the world’s Oil and Gas Provinces by known Petroleum Volumes. U.S. Geological Survey Open-file Report. 1997:97-463.
CrossRef - Doust, H., Omatsola, E. Niger Delta. American Association of Petroleum Geologists Bulletin Memoir. 1990: 48:201-328
CrossRef - Kulke, H. Nigeria, in Kulke, H., ed., Regional Petroleum Geology of the World. Part II: Africa, America, Australia and Antarctica. Berlin, Gebruder Borntraeger. 1995:143-172.
- Hospers, J. Gravity field and structure of the Niger Delta, Nigeria, West Africa. Geological Society of American Bulletin. 1965:76:407-422.
CrossRef - Kaplan, A., Lusser, C.U., Norton, I.O. Tectonic map of the world, panel 10: Tulsa, American Association of Petroleum Geologists, scale 1:10,000,000. 1994.
- Avbovbo, A.A. Tertiary Lithostratigraphy of Niger Delta. American Association of Petroleum Geologists Bulletin. 1978: 62:295-300
CrossRef - Ekweozor, C.M., Daukoru, E.M. Northern delta depobelt portion of the Akata-Agbada petroleum system, Niger Delta, Nigeria, in, Magoon, L.B., and Dow, W.G., eds., The Petroleum System—From Source to Trap. American Association of Petroleum Geologists Bulletin, v. AAPG Memoir. 1994:60:599-614.
CrossRef - Petroconsultants. Petroleum Exploration and Production Database: Houston, Texas, Petroconsultants, Inc.1996
- Doust,H., E. Omatsola, “Niger Delta, in, Edwards, J. D., and Santogrossi, P.A., eds., Divergent/Passive Margin Basins,” American Association of Petroleum Geologist Memoir 48: Tulsa, American Association of Petroleum Geologists, pp.239-248, 1990
CrossRef - Larionov, V. Borehole Radiometry: Moscow, U.S.S.R., Nedra. 1969.
- Dresser, A. Log Interpretation Charts. Dresser Industries Inc., Houston, Texas. 1979:p.107
- Baker, H.I. Advanced Wireline and MWD Procedures Manual. B.H.I Technical Publications Group. 1992: p.80

This work is licensed under a Creative Commons Attribution 4.0 International License.