Acoustic Feature Extraction Based on Wavelet Transform for Industrial Induction Motor-Driven Belt Conveyor Condition Monitoring
Long Xiao*  and Zhiping Wang
1Singapore Institute of Manufacturing Technology, Agency for Science, Technology and Research, Fusionopolis Way, Innovis , Singapore, Republic of Singapore .
http://dx.doi.org/10.13005/OJPS09.01.08
The industrial induction motor-driven belt conveyor is an essential component in manufacturing facilities. Any unexpected shutdown can lead to significant disruptions, resulting in financial losses amounting to thousands of dollars per hour. Unfortunately, efficient mechanisms for monitoring the conveyor's condition are often lacking. Therefore, it is crucial to ensure early, precise, and effective detection of malfunctions in belt conveyors. This necessitates the identification of distinctive anomalies stemming from initial damage to the rotating machinery and motor components. This paper presents a non-invasive acoustic monitoring technique designed specifically for industrial belt conveyors. The method employed relies on wavelet transform-based feature extraction, offering notable advantages in terms of classification accuracy, time efficiency, and the quantity of feature vectors required for classifier training.
Copy the following to cite this article:
Xiao L, Wang Z. Acoustic Feature Extraction Based on Wavelet Transform for Industrial Induction Motor-Driven Belt Conveyor Condition Monitoring. Oriental Jornal of Physical Sciences 2024; 9(1).
DOI:http://dx.doi.org/10.13005/OJPS09.01.08Copy the following to cite this URL:
Xiao L, Wang Z. Acoustic Feature Extraction Based on Wavelet Transform for Industrial Induction Motor-Driven Belt Conveyor Condition Monitoring. Oriental Jornal of Physical Sciences 2024; 9(1). Available here:https://bit.ly/3YfJaSf
Download article (pdf) Citation Manager Publish History


Introduction
Industrial conveyor systems are pivotal mechanical assemblies designed for the effortless transportation of materials. These systems typically consist of a supportive frame, driven by an induction motor, on which a belt carries materials from one location to another 1. The significance of conveyor systems in industries, such as mining and manufacturing, cannot be overstated, as they are responsible for the transport of vast quantities of bulk materials and products over considerable distances. However, the complexity of belt conveyor systems, coupled with the often-reactive nature of maintenance procedures, results in substantial financial losses amounting to thousands of dollars per hour when a conveyor belt system fails. The root cause of this issue is the absence of efficient mechanisms for monitoring the condition of these systems. Acoustic-based condition monitoring presents an appealing solution due to its convenience, cost-effectiveness, non-invasive, and real-time information acquisition attributes2. Signal preprocessing can reveal non-stationary points, seasonal specifications, and specific information in the time and frequency domain. The Wavelet method is a well-known technique that could be used as a signal preprocessing method3. Furthermore, by employing a wavelet transform (WT) based extraction algorithm, the accuracy of fault detection can be significantly enhanced 4. This paper introduces a novel approach known as the WCE ratio (WCER) feature extraction method for effective belt conveyor system monitoring, as in Fig. 1. The performance of this approach is rigorously evaluated, comparing it to other techniques like the wavelet coefficient (WC) feature extraction method and FFT-based methods. Diverging from traditional spectral-domain or time-domain approaches, the WT-based method enables the extraction of features from both time- and wave-spatial information, which are subsequently amalgamated to train a classifier, ultimately improving the overall classification accuracy.
 | Figure 1: The proposed method for extracting wavelet transform features from acoustic signals follows this flow |
Wavelet Coefficients Energy Ratio based Feature Extraction Method
Wavelet transform emerges as a highly promising signal processing technique with diverse applications encompassing data analysis and denoising 5. It contains essential information regarding time and scale distribution aspects, effectively representing signal components within distinct frequency bands. This distinctive feature facilitates the differentiation of signals associated with different targets. In contrast to Fourier series expansion, which predominantly offers frequency resolution while neglecting time resolution, wavelet transform excels by providing information concerning the respective time-spatial location and frequency wavenumber6. This, in turn, enables localized analysis within time-scale domain or the time-frequency 7. The essence of wavelet transforms lies in its ability to decompose a signal into a set of wavelets, thus yielding a valuable time-frequency representation of the signal8. Wavelets are characterized by their irregular shape and finite duration, rendering them particularly adept at analyzing signals with variable spectral content and transitory characteristics8. Utilizing a set of base functions9, wavelet transform dissects a signal into a family of wavelet coefficients. These coefficients provide a comprehensive signal time-frequency representation. The continuous wavelet transform (CWT) for a continuous signal is defined as:
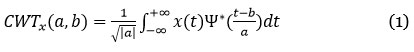
where (t) is the mother or basic wavelet with a bandpass function10, a is the scale factor, and b is the time shift. In this paper, decomposing the signal involves using a smaller among of scales, each with a varying amount of translations. This approach helps avoid a large redundant information compared to continuously varying the parameters.
 | Figure 2: Three-level wavelet decomposition Haar Wavelet function |
Fig. 2 illustrates a three-level wavelet decomposition scheme using the Haar discrete wavelet transform (DWT). Here, X(t) represents the signal sequence. Lp and Hp are the (p -1)th level orthogonal filter bank coefficients in the wavelet decomposition processing. For the low-frequency components, the term ap(t) denotes the pth level wavelet approximation coefficients. Similarly, for the high-frequency components, dp(t) denotes the jth level wavelet detail coefficients. The formula for calculating the wavelet coefficients dp(t) is given as:
![]()
where p is the desired depth of the wavelet transform,
![]()
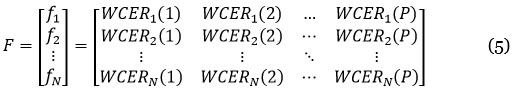
And the extracted feature matrix of the acquired signal is expressed as:
Experimental setup
In this study, a commercial acoustic sensor (SR40M) was installed beneath the frame supporting the conveyor belt to capture acoustic signals, as in Fig. 3. The malfunctioning condition was introduced by replacing a roller on the belt conveyor that had a minor lack of lubrication. The sensor recorded these signals at 44,100 Hz sampling rate. The signals were generated by the conveyor system under both normal and malfunctioning conditions, with each condition lasting for a duration of 20 seconds. This resulted in the acquisition of data sequences, each containing 1,764,000 data points. To facilitate the subsequent analysis, we employed a segmentation approach with a fixed segment length (L) of 512 points. This means the acquired signal sequence was separated into 3,445 segments, and every 512 points forming an individual segment for feature extraction. In essence, the data sequence was broken down into consecutive segments, where the first segment spanned from point-1 to point-512, and the second segment spanned from point-513 to point-1,024, and so forth, thus allowing for a comprehensive analysis of the entire data sequence.
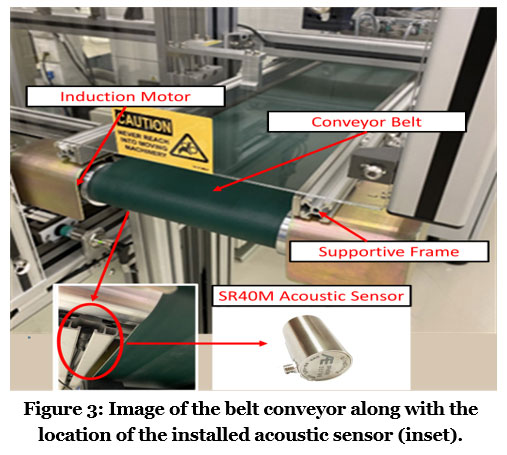 | Figure 3: Image of the belt conveyor along with the location of the installed acoustic sensor (inset). |
Following this, the obtained acoustic signal from the conveyor belt underwent processing by the feature extraction module utilizing the WC and WCER. The depth of the wavelet transform was configured to 100.
 | Figure 4: Acoustic signal and wavelet transform coefficient of the belt conveyor system running under (a) normal condition and (b) malfunctional condition |
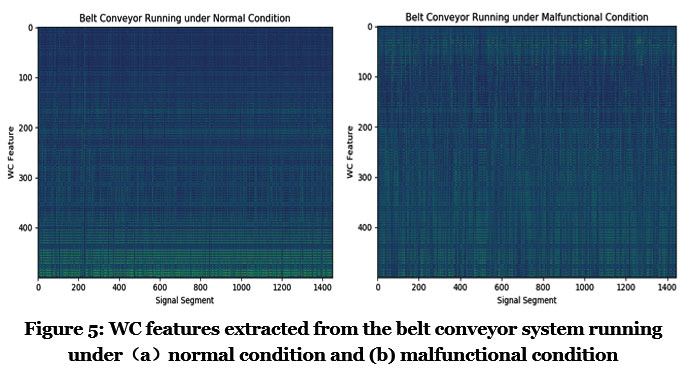 | Figure 5: WC features extracted from the belt conveyor system running under (a) normal condition and (b) malfunctional condition |
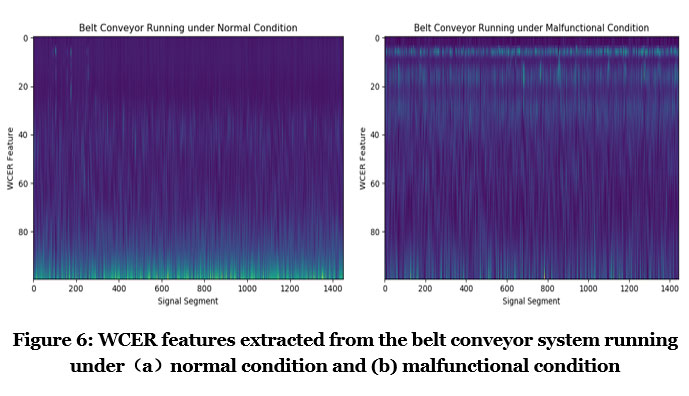 | Figure 6: WCER features extracted from the belt conveyor system running under (a) normal condition and (b) malfunctional condition |
Fig. 4 shows the acoustic signals acquired from acoustic sensor and their corresponding wavelet transform domains under both normal and malfunctional runs of the belt conveyor. Fig. 5 shows the extracted acoustic signal features using the WT method. Additionally, Fig. 6 shows the characteristics derived from the WCER method-based segmented acoustic-signal sequence. The horizontal axis denotes the signal segment number, akin to a compilation of observations for specific feature variables. Conversely, the vertical axis illustrates the WCER values that relate to the segments of the signal. Notably, the differences in WCER features between the normal and malfunctional conditions are more pronounced compared to those in WC features. This heightened distinction in WCER features provides a clearer reflection of the target's characteristic variations.
Feature Vector Simplification Using Principal Component Analysis Method
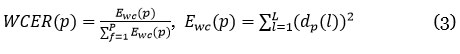
In this study, we employed the Principal Component Analysis (PCA) method11 to condense the feature matrix by isolating key factors that play a crucial role in signal differentiation. Simplifying the feature vectors by removing redundant variables can significantly decrease computational complexity and effectively reduce data processing time while preserving accuracy. According to Eq. (5), the feature matrix F comprises feature vectors fn, which represent the variable data sequence for each feature vector, f. It is essential to normalize the variables following the procedure outlined in Eq. (6) before proceeding with the principal component analysis:
![]()
where un is the mean, Sn is the standard deviation of the sequence of the variable, Wn. Then, correlation coefficient matrix can be worked out by working out the variables correlation coefficient in the feature vector as:
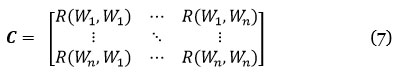
Subsequently, all the eigenvalues, denoted as hi (where i = 1, 2, …, n), of the correlation coefficient matrix, C, along with their eigenvectors, [ei1, ei2, …, ein], are calculated. These eigenvectors are then used to form a set of m new indicator variables, as illustrated:
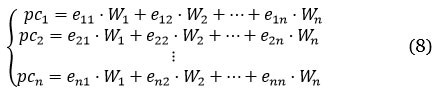
where pcn is the nth principal component. The contribution rate of each principal component signifies the impact on the variability of the target features. To distill the most crucial information and streamline the feature vectors, we opt to select the first few principal components with the highest contribution rates rather than retaining the original features. In Fig. 7, the initial 10 principal components of WC and WCER features are displayed, revealing that the cumulative contribution rate of the first 5 principal components (PCs), denoted as [pc1, pc2, …, pc5], amounts to approximately 1. Consequently, these 5 PCs were chosen for subsequent classification tasks.
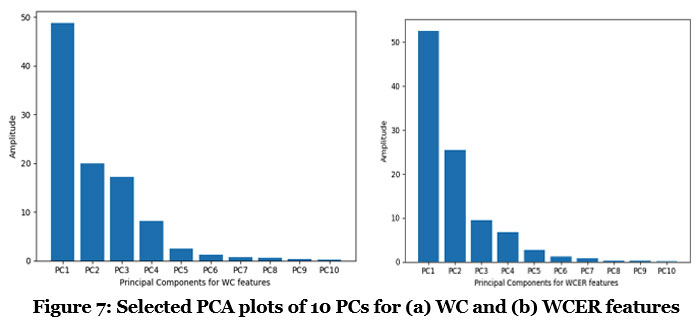 | Figure 7: Selected PCA plots of 10 PCs for (a) WC and (b) WCER features |
Following the simplification of features, we employed the streamlined WC and WCER features of the signal for target classification. Our study primarily utilized the Support Vector Machine (SVM) as a classifier to evaluate the effects of feature simplification and the wavelet feature extraction (WFE) method. In multidimensional space, the SVM's core principle involves treating a multi-variate feature as an independent point and then determining the optimal hyperplane for classifying these independent points using training data. The SVM employed the C-support-vector classifier (C-SVC) from LIB-SVM 12. The formular of the C-SVC function is expressed as,
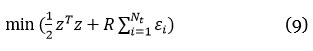
subject to the constraints
Additionally, the function for the classification of a feature f, is expressed as:
![]()
The labels of the class are represented as either 1 or -1, representing different types of targets, such that yiE{1, -1}. Additionally, we applied a radial basis function (RBF) kernel 13, with the following the format:
![]()
where the Y is set at 0.5, and the SVM classifier was trained by the feature data from both normal and malfunctional runs. Following training, the SVM classifier was employed to classify a real data-set comprising 1600 signal segments.
Performance of WCER Method
The WC and WCER feature-based methods were evaluated based on their performance, considering both time consumption and accuracy. Accuracy was quantified using the following definition
The average classification accuracy was computed for both the original features and the features after dimension reduction, providing an assessment of the impact of feature simplification. The summarized results are presented in Table 1.
Table 1: Comparison of the results of each method.
Parameters | WC Feature with PCA Simplification | WCER Feature without PCA Simplification | WCER Feature with PCA Simplification |
Time Consumption of Feature Extraction | 67.93 s | 227.82 s | 74.22 s |
Time Consumption of SVM classification | 1.63 s | 0.29 s | 0.24 s |
Average Classification Accuracy | 89.33% | 96.52% | 96.40% |
Average Accuracy for Normal Condition | 83.59% | 91.81% | 92.40% |
Average Accuracy for Malfunctional Condition | 96.96% | 98.98% | 98.02% |
The WCER feature extraction, coupled with simplification methods, effectively captures target features within the signals. As displayed in Table 1, the time required for classifying belt run data using the WCER feature extraction method is marginally longer compared to the WC feature method. However, the classification accuracy significantly improves, reaching approximately 96%, reflecting an approximate 6% enhancement. Furthermore, when applying PCA simplification to the WCER feature vectors, the time consumption for feature extraction reduces almost threefold, without compromising the accuracy of target classification. The simplified WCER features based average classification accuracy was only 0.12% lower than that of the non-simplified features. This slight difference can be attributed to the removal of redundant elements during the simplification process, which had no discernible effect on the target signal overall characteristics. Fig. 8 illustrates the relationship between accuracy and the quantity of feature vectors required for classifier training. Notably, WCER feature vectors outperform WC when employing an identical number of feature vectors. However, both WC and WCER accuracy tend to plateau after approximately 500 feature vectors used for classifier training.
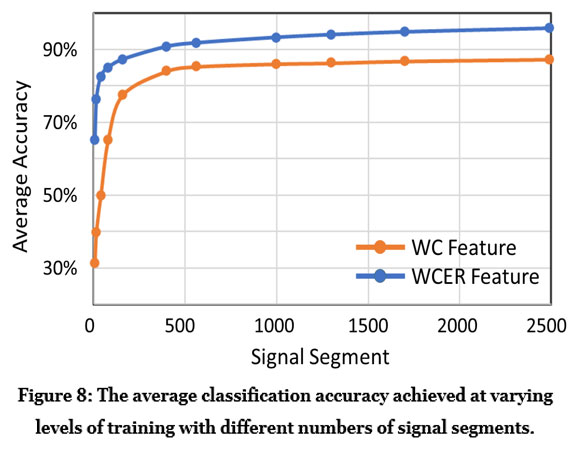 | Figure 8: The average classification accuracy achieved at varying levels of training with different numbers of signal segments. |
Additionally, the FFT-based feature extraction methods were notably faster, with an average time consumption approximately 3 to 5 seconds shorter than that of the WCER method. However, they exhibited a significantly lower average classification accuracy, with an 8.2% reduction compared to the WCER method. This difference can be attributed to the fact that the FFT-based method only extracts the energy of the target signal low-frequency band for classification, while the WCER method utilizes all spectral energy characteristics within the signal for effective classification. Additionally, the WCER method required less time for feature extraction from the target acoustic signal compared to the FFT-based method, as wavelet decomposition is more time-efficient than performing FFT operations on the same signal sequence. Moreover, the WCER method extracts fewer signal features compared to the FFT method, leading to reduced time for processing subsequent target classification.
In this paper, we proposed a non-invasive acoustic monitoring technique designed for industrial belt conveyors. A feature extraction method based on wavelet transform and WCER is presented. The acoustic WCER feature extraction method is employed for SVM classification after simplifying the target signal features using the PCA method. This study evaluates both time consumption and target classification accuracy. Experimental results demonstrate that the WCER feature extraction coupled with simplification approach, efficiently and accurately captures target features and monitors conveyor conditions. This approach ensures high classification accuracy, reduced time consumption, and a manageable number of feature vectors necessary for classifier training, making it a promising candidate for belt conveyor condition monitoring.
Acknowledgment
This work has been supported from the Singapore Institute of Manufacturing Technology.
Funding Source
Singapore Institute of Manufacturing Technology, P20-E2-112C project grant.
Conflict of Interest
The authors declare that they have no known competing financial interests or personal relationships that could have appeared to influence the work reported in this paper.
References
- Sohraby, K.; Minoli, D.; Znati, T. Wireless Sensor Networks: Technology, Protocols, and Applications, 1st Ed John Wiley & Sons, Inc.: Hoboken, NJ, USA, 2007.
- Mazarei Behbahani, M., Mazarei, A. A new criteria for determining the best decomposition level and filter for wavelet-based data-driven forecasting frameworks- validating using three case studies on the CAMELS dataset. Stoch Environ Res Risk Assess 37, 4827–4842, 2023
- Alireza B. Dariane, Mohammad Reza M. Behbahani, Maximum energy entropy: A novel signal preprocessing approach for data-driven monthly streamflow forecasting, Ecological Informatics, Volume 79, 2024, 102452
- Jiayang Liu, Qiang Zhang, Deng Li, Yun Teng, Shijing Wu, Xiaosun Wang, A parameter-adaptive spectral graph wavelet transform method for wind turbines vibration signal denoising, International Journal of Mechanical Sciences, Volume 270, 2024, 109075
- Shahbakhti, M. A Novel DWT Method for ECG Noise Elimination. IEEJ Trans. Electr. Electron. Eng. 2015, 10, 353–355
- N. V. Thakor, B. Gramatikov and D. Sherman, “Wavelet (Time-Scale) Analysis in Biomedical Signal Processing”, The Biomedical Engineering Handbook: Second Edition., Ed. Joseph D. Bronzino, Boca Raton: CRC Press LLC, 2000
- M. El H. Benbouzid, A Review of Induction Motors Signature Analysis as a Medium for Faults Detection, IEEE Transac¬tions on Industrial Electronics, Vol. 47, No. 5, Oct. 2000
- N. Mehala, Current Signature Analysis for Condition Monitoring of Motors, Int. Journal of Electronics and Computer Science Engineering, Vol. 1, No. 3, 2013
- Qin, Z.G.; Chen, L.; Bao, X.Y.Wavelet Denoising Method for Improving Detection Performance of Distributed Vibration Sensor. IEEE Photonics Technol. Lett. 2012, 24, 542–554.
- Rioul, O.; Duhamel, P. Fast Algorithms for Discrete and Continuous Wavelet Transforms. IEEE Trans. Inf. Theory 1992, 38, 569–586.
- Cao, L.J.; Chua, K.S.; Chong, W.K.; Lee, H.P.; Gu, Q.M. A comparison of PCA, KPCA and ICA for dimensionality reduction in support vector machine. Neurocomputing 2003, 55, 321–336.
- Chang, C.C.; Lin, C.J. LIBSVM: A Library for Support Vector Machines. ACM Trans. Intell. Syst. Technol. 2011, 2, 27.
- Liu, Q.Z.; Chen, C.H.; Zhang, Y.; Hu, Z.G. Feature selection for support vector machines with RBF kernel. Artif. Intell. Rev. 2011, 36, 99–115.

This work is licensed under a Creative Commons Attribution 4.0 International License.