Determination of Fluoride Content of Selected Brands of Bottled Water Sold in Lafia Town using two Different Methods
U. A. Augustine*  , M. S. Abubakar , T .M. Akpomie , A. S. Onipede and D. A. Samuel
1Department of Chemistry, Faculty of Science, Federal University of Lafia, Nigeria .
http://dx.doi.org/10.13005/OJPS08.02.07
Copy the following to cite this article:
Augustine U. A, Abubakar M. S, Akpomie T. M, Onipede A. S, Samuel D. A. Determination of Fluoride Content of Selected Brands of Bottled Water Sold in Lafia Town using two Different Methods. Oriental Jornal of Physical Sciences 2023; 8(2). DOI:http://dx.doi.org/10.13005/OJPS08.02.07
Copy the following to cite this URL:
Augustine U. A, Abubakar M. S, Akpomie T. M, Onipede A. S, Samuel D. A. Determination of Fluoride Content of Selected Brands of Bottled Water Sold in Lafia Town using two Different Methods. Oriental Jornal of Physical Sciences 2023; 8(2). Available here: https://bit.ly/42g2PSl
Download article (pdf) Citation Manager Publish History


Introduction
Fluorine is among the most abundant elements that occur naturally. In humans, about 96 % of fluoride is located in bones and teeth. Fluorine is important as it aids in usual mineralization of bones and forming of tooth enamel. Two-edged sword is what fluorine is normally called. Fluoride has an essential role of preventing dental caries, and when deficient can cause certain dental issues.1 However, too much exposure to fluoride can cause dental problems such as mild dental fluorosis and excruciating skeletal fluorosis.2,18 Even though the main advantage of fluoride is its external touch with teeth, sufficient ingestion of fluoride is important for healthy teeth, mostly in children.3 Water is the major root of intake of fluoride in our body, therefore ,understanding the contents of fluoride in potable water is crucial.4 The content of fluoride in potable water endorsed by the World Health Organization (WHO) is 0.5 to 1.5mg/L.5 Due to this recommendation, many countries approved 1.5 mg/L as the maximum contaminant level (MCL) for fluoride content in potable water.6 It was investigated and found that the fluoride concentration in drinking water of Iran is generally beyond the maximum contaminant level, and in certain areas. This results to dental fluorosis in such regions.7 Conversely, dental carries which is caused by deficiency of fluoride is another issue of worries in certain areas of Iran.8 Generally, tap water has contributed greatly to sum of water ingestion, and more than 40% of daily water consumption is from tap, mostly when the temperature of air gets lower than 21 °C.9 Based on a report from a commercial source, up to 800 million L of bottled water were taken in UK in 1995 and has increased tremendously in year 2000.10 There is no approved standard concerning fluoride concentration of bottled water in Iran, even though, contents of certain elements like Ca, Na, Fe, Ag and Al, in bottled water is endorsed in certain countries.11,12 Showing the content of fluoride on labels of bottled water is not mandatorily legal, but producers are notified to enlist contents of nutrition of individual brands. There is high variability of fluoride concentrations of bottled waters, leading to dental problems for such people, mostly children taking them as their main source of potable water.13 An initial step towards investigating effects of exposure to fluoride via taking of bottled water is by the determination of the fluoride levels of such bottled waters. The greatest cost-efficient, proficient and credible analytical tool, normally used to determine concentrations of fluoride in potable water is ion-selective electrode (potentiometric method).14Using this method, it is feasible to determine the total amount fluoride that is free and complex-bound soluble in water. Ion-selective electrode can be applied when fluoride contents in water is not lower than 20 μg/L.14 We consume more water when there is increase in temperature, humidity and exercise. State of human health or well being and other factors such as diet could also modify our level of water consumption.5
Fluoride in organism including humans is related to individual’s age, health status and body mass or weight with its optimum, secured-tolerant and toxicity dosage. At initial year of a man’s existence, concentration of fluoride is optimum at 0.045 mg/kg body weight, 0.073 mg/kg tolerant level, and chronic toxicity of 0.150 mg/kg. In adults, 0.020-0.025 mg/kg of body mass is the optimum dose of fluoride.14 Fluoride occurs more often in several sources of water, with higher contents found in groundwater as a result of fluoride-bearing minerals. Cryolite, fluorspar, fluorspatite and hydroxylapatite are the major origins of fluoride in ground water.15 In the gastrointestinal tract, water-soluble fluorides are easily and virtually completely absorbed after intake. Fluoride absorbed is conveyed through the blood; and with long time ingestion of fluoride from potable-water, its blood content remains same as potable water. This remains same as a correlation up to a level of ten mg/L in potable-water. Distribution of fluoride is a quick one. In teeth and bones; fluoride is attached, and does not almost get stored in the tissues that are soft.16,17 The fluoride attachment in the tissues of our teeth and skeletons can be reversed when the exposure has stopped, and there will be mobilization these tissues. Fluoride can be passed out of the body through faeces, sweat and urine.16,17 Fluoride can also be absorbed via inhaled particles, and the rate of absorption relies on particles’ size and how soluble the fluoride compounds are.18
There was no record of statistical significant increase in the incidence of any tumour in any single exposed group in a particular detailed carcinogenicity bioassay study in which male and female groups of F344/N rats and B6C3F1 mice were given drinking-water containing up to 79 mg of fluoride per litre as sodium fluoride for a period of 2 years. There was a statistical significant increase trend of an incidence of osteosarcomas in male rats with more exposure to fluoride, but the incidence was within the range of historical controls.18 Furthermore, a 2-year carcinogenicity bioassay involving Sprague-Dawley rats administered up to 11.3 mg/kg of body weight per day in the diet did not have statistical significant increase in the incidence of osteosarcoma or other tumours.18,19 More study, which reported an increased incidence of osteomas in mice ingesting up to 11.3 mg/kg of body weight per day, is hard to interpret because the animals were having type C retrovirus.18
Dental fluorosis (yellowish or brownish striations or mottling of the enamel) can take place when there is elevated amounts of fluoride up to 10 mg/Liter concentrations, whereas, below 0.1 mg/Liter could probably cause dental caries20. More so, not taking correct diet is also an essential surportive factor that influences dental caries. Dental caries’ level normally measured as the mean number of decayed, filled or missing teeth is within 7 at a F-content of 0.1 mg/Liter to around 3.5 at a F-content of 1.0 mg/Liter. However, about 20% of children may have dental fluorosis, but of a mild extent of seriousnes and would not be apparently noticeable to them or their loved ones. 20 Furthermore, it has been studied and observed that a suitable substitution between caries and fluorosis occur around 0.7 mg/L content of F-9
Incidence of dental caries (cavities) can be tremendously reduced by adding fluoride to toothpaste and potable water. Even though, adding of fluoride is surely efficient, plenty of it can be detrimental; and hence, it is crucial to have a suitable method for watching fluoride level.5 Fluoride is regarded as one of the very few compounds that has exhibited significant effects in humans. There is a slim boarder between the required and toxic dose of fluoride in our body.4 In drinking water, low concentration of fluoride is considered valuable in preventing dental carries.21 Too much intake of fluoride can result to some harmful effects such as fluorosis.5,22,23A number of researchers have determined the fluoride concentration of potable water in many areas of the globe and compared the concentrations to the maximum level recommended by WHO, FAO and EC as the intake of fluoride in amount above this maximum level may be inurious to health.
Lafia which is the capital of Nasarawa-Statehave different brands of bottled watersold in almost every part of the town. A large population consumes these brands of bottled water and the fact that such population is exposed to fluoride suggests the need for the determination of fluoride concentration in selected bottled water sold in Lafia.Hence, the aim of this research was to determine the fluoride content in selected brands of bottled water sold in Lafia, Nasarawa-state Nigeria and to ascertain whether the concentration of fluoride could pose a potential health threat to consumers by comparing it with the maximum level stipulated by World Health Organization (WHO).To the best of the knowledge of available data on literature, there is little or no data in fluoride contents of bottled water sold in Lafia town.
Methodology
Apparatuses and Chemicals
Distilled waterBeakers
Glacial acetic acid
Sodium chloride
1,2-cyclohexylenedinitrotetraaceytic acid(CDTA)
Sodium hydroxide
Volumetric flask
Sodium fluoride
Polyethylene bottle
Desiccators
Weighing balance
TISAB solution
Deionised water
14.Magnetic stirrer
Portable Photometer (HI96739C)
Cuvettes for samples and caps (2 )
Cloth for cleaning cuvette
Eriochrome cyanine R
Fluoride reagent
Study area
Lafia is a city in the north- central part of Nigeria and the capital of Nasarawa state. It has the coordinate’s 8°29'30''N 8°31'0''E/8.49167°N 8.51667°E. Based on 2006 census results, has a population of 330,712 inhabitants.24 Climate of Lafia is tropical savannah with an mean yearly temperature of 36 °C. Lafia is located on the trunk railway from Port Harcourt and on the main highway between Makurdi and Jos. 24 According to Encyclopaedia Britannica (2006), Lafia which was originally known as Lafia Beri-Beri was originally the site of Anane, a small town of the Koro indigenes before it became the capital of a prominent chiefdom in the 19th century. There is a collecting point for sesame seeds, soybeans and a trading centre for yams, sorghum, millet and cotton in Modern Lafia . Moreover, farming which is a customary essential activity of the town’s permanent inhabitants, tin and columbite are mined nearby while a deposit of coal is in the southeast of the town. Lafia modern market is the major market in Lafia. The town can be accessed by road from neighbouring cities within states like Akwanga, Jos, Makurdi, Abuja and Lokoja. Lafia can also be accessed by rail through a connection to the east line railway axis and is served by the main narrow gauge railway that starts from Port Harcourt. Rail transport to Lafia from other parts of the country was renowned but due to economic crunch on the railway sector in Nigeria, it is currently struggling to bounce back, and therefore commuting to Lafia via trains has continued to retrogress and no longer popular. 24
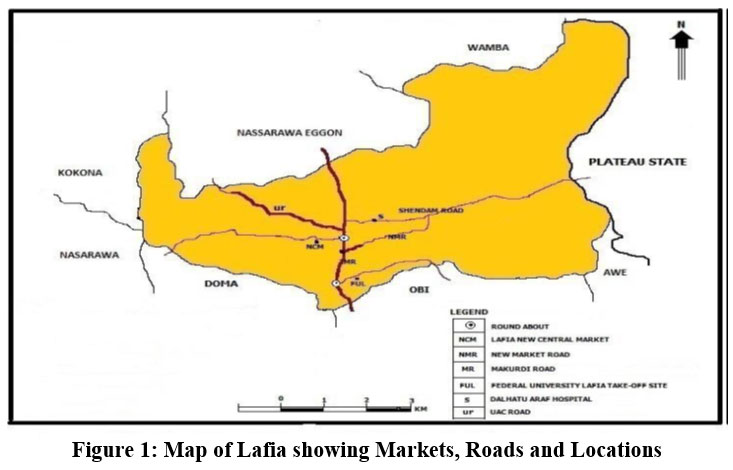 |
Figure 1: Map of Lafia showing Markets, Roads and Locations. Click here to view Figure |
Sample Collection
A total of five different brands of bottled water (with five different batch numbers for each sample) were collected from three distinct sellers at Makurdi road and the Lafia modern market in Lafia town. The samples were denoted as follows: A(A1-A5), B(B1-B5),C(C1-C5),D(D1-D5) and E(E1-E5). One (1) to five (5) denoting five different batch numbers for each sample.
Experimental Procedure for ISE Method
Preparation of calibration standards and unknown
Not less than five calibration standards ranging from 0.1 mg/L fluoride to 10 mg/L was prepared by pipetting required quantity of the fluoride stock solution into 1000 mL volumetric flasks. Fifty mL of the Total Ionic Solid Adjustment Buffer (TISAB) solution was added and made up to the mark with deionized water. The standards were stored in polyethylene containers.
Sample of twenty-five mL of the unknown was pipetted into a 50.00 mL volumetric flask and made to the mark with Total Ionic Solid Adjustment Buffer (TISAB).
Reference electrode was filled with the required solution and was attached to the meter. The cap was removed from the fluoride electrode, and rinsed with deionized water and connected to the meter. Both electrodes were carefully dried with a tissue.
Enough of the solution to be measured was placed in a plastic beaker so that the solution was covered to about 1cm of the tip of the electrodes, with enough space between the electrode and the bottom of the beaker for a magnetic stirring bar. The beaker was placed on a magnetic stirrer after carefully placing magnetic stirring bar in the beaker. The stirrer was set for moderate stirring after lowering the electrodes into the solution, and before commencing the stirring the stirring bar was not allowed to strike the electrodes.
Prior to taking the meter reading, it was set to read relative millivolts. The reading was taken to the maximum precision of the scale after allowing it to stabilize for five minutes. For very low concentrations in Particular, the voltage may drift slowly for some time. Provided all solutions were read after the same amount of time for equilibration, taking the reading at the end of five minutes has been found to give consistent results.25 This was done in triplicates.
Photometric method
Calibration
The cuvettes was washed and rinsed with deionized water. A known concentration of fluoride sample content was used to test-run the meter, and this was to ensure that the meter was working and reading in a good and required range. Calibration of the apparatus was appropriately carried out, and the cuvettes were individually rinsed with the samples to be analyzed in order to get accurate concentration range and minimize errors that may result from contamination of the samples.26
Procedure
On the Photometer, fluoride method was selected. Two mL of HI 93729-0 SPADNS reagent each was added to two cuvettes. One of the cuvettes was filled with distilled water up to the mark, cuvette cap was replaced and inverted several times to mix. The other cuvette with sample was filled up to the mark. The cap of cuvette with sample replaced and then inverted severally to mix. The cuvette with the reacted distilled water was placed into the holder and the lid closed. The timer was pressed and the displays showed the countdown prior to zeroing the blank or, alternatively, waited for two minutes and pressed zero. The measurement was taken and the result was displayed in mg/L of fluoride. The cuvette with distilled water was removed. The other cuvette with the reacted sample was also inserted into the instrument and the results were displayed in mg/L of fluoride. The same procedure was carried out for the rest of the samples analyzed and was done in triplicates.26
Results Analysis based on Statistics
Statistical Package for Social Science, SPSS (version 26) was applied to derive descriptive data of this research.
Results And Discussion
Results
Table 1: The Results of ISE and Photometric Methods (Mean±SD)
|
Sample ID |
Ion Selective Electrode (ISE) Method (mg/L) |
Photometric Method (mg/L) |
|
A
|
0.30±0.01 |
0.51±0.02 |
|
B
|
0.53±0.03 |
0.65±0.14 |
|
C
|
0.33±0.05 |
0.71±0.18 |
|
D
|
0.31±0.11 |
0.88±0.13 |
|
E |
0.44±0.12 |
0.73±0.19 |
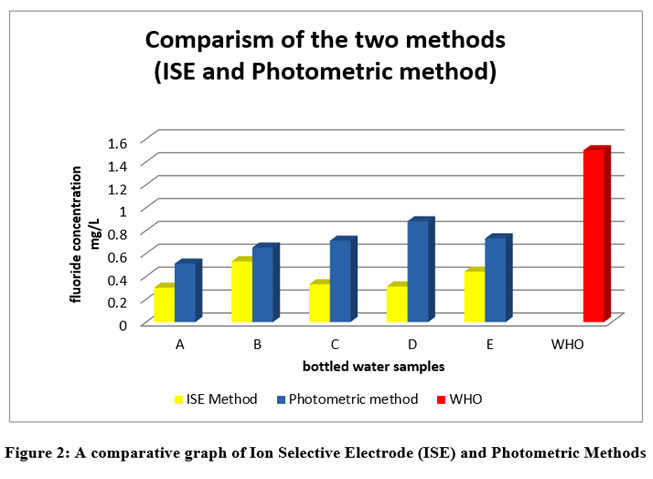 |
Figure 2: A comparative graph of Ion Selective Electrode (ISE) and Photometric Methods. |
Discussion
The mean concentration of fluoride (mg\L) in bottled water studied using ISE (potentiometric) method were found to be 0.30±0.01, 0.53±0.03, 0.33±0.05, 0.31±0.11 and 0.44±0.12 mg\L for sample A, B, C, D and E, respectively as given in Table 1. The results revealed that the concentration of fluoride in the bottled water were lower than the recommended limit of World Health Organization, WHO (0.5 to 1.5 mg\L)(WHO, 2004)29, with the exception of sample B (0.53 mg\L) which was within the range of permissible limit of WHO(2004).29 There was no significant difference on the five different batches for each brand of bottled water sample analyzed using ISE method (P< 0.05). The concentration of fluoride (mg\L) in bottled water using photometric method were found to be 0.51±0.02, 0.65±0.14,0.71±0.18, 0.88±0.13 and 0.73±0.19 mg\L for sample A, B, C, D and E, respectively as given in Table 1.The results obtained through photometric method were within the permissible limit of WHO.29 There was no also significant difference on the five different batches for each brand of bottled water sample analyzed using photometric method (P < 0.05). The fluoride concentrations obtained via photometric method were significantly higher than the ISE method (P< 0.05) as shown in Figure 2.The variation on the results of the two methodswas due to the sensitivity of the analytical instruments which indicated that photometric method was more sensitive than ISE method. The results obtained in this present study using ISE method was similar to research works on determination of concentration of fluoride in different brands of bottled water using ISE method done by Kotecha et al.(2012) in district of Gujarat, India, Zohouri et al.(2003) in Northeast of England and Brandao andValsecki(1998) in the city of Fortaleza, CE, Brazil. However, results of present study obtained by photometric method were significantly higher than three other studies mentioned above done by ISE method.10,27,28. Generally, the results obtained from this study were in line with a study carried out by Augustine et al. (2019) where fluoride contents obtained via photometric method was significantly higher than that determined by potentiometric method in selected sachet table water sold in Lafia, Nasarawa State-Nigeria30.
Conclussion
The concentration of fluoride determined in five (5) different brands of bottled water of this research using ISE method was significantly lower than the recommended value by World Health Organization (WHO) except sample B which was within the WHO recommended limit and that of photometric method was within the recommended limit of WHO. Results of the analysis carried out also revealed that photometric method was more sensitive than ISE method as concentrations of fluoride obtained using ISE method was lower than that of photometric method. The determination of fluoride content in drinking water is of great importance for human health because daily intake of certain proportion within recommended limit is essential for prevention of tooth decay and in excess can lead to dental and skeletal fluorosis.
Acknowledgement
The authors acknowledge all technical staff of the Department of Chemistry laboratory, Federal University of Lafia for their assistance during the bench work. Also, the authors are grateful to Federal University of Lafia for allowing us make use of the Laboratory.
Funding Sources
There is no funding or financial support for this research work.
Conflict of Interest
The authors declare no conflict of interest.
References
- Griffin SO, Regnier E, Griffin PM, HuntleyV. Effectiveness of fluoride in preventing caries in adults. Journal of Dental Research. 2007; 86(5): 410-415.
CrossRef - Williams DM, Chestnutt IG, Benett PD, Hook K, Lowe R. Characteristics attributed to individuals with dental fluorosis. Community Dental Health. 2006; 23(4): 209-216.
- Hardman MC, Davies GM, Dusbury JT, Davis RM. A cluster randomized controlled trial to evaluate the effectiveness of fluoride vanish as a public health care measure to reduce caries in children. Caries Research. 2007; 41(5): 371-376.
CrossRef - Shailaja K, Johnson ME. Fluoride in ground water and its impact on health. Journal of Environmental Biology. 2007; 28(2): 331-332.
???????CrossRef - World Health Organization. “Fluoride in drinking-water.IWA publishing London. 2006;83: 1-3
- Hurtado R, Gardea-Torresdey J, Tiemann KJ. Fluoride occurrence in tap water at Los Attos de Jalisco in the central Mexico region proceedings of the 2000 conference on hazardous waste research. 2000; 32:15-18.???????
- Ramezani GH, Valaie NB, Eikani H. Prevalence of DMFT and Fluorosis in the students of Dayer city. Iran. J. Indian Soc. Pedo. Prev. Dent. 2004; 22(2): 49-53.
- Meyer-Luekel H, Bitter K, Shirkhani B, Hopfenmuller W, Kielbassa AM. Prevalence of caries and fluorosis in adolescent in Iran. Quintessence international.2007;38: 459-465.
- Heller KE, Sohn W, Burt BA, Eklund. Water consumption in the United States in 1994-96 and implications for water fluoridation policy. Public Health Dentition. 1999; 59:3-11.
CrossRef - Zohouri FV, Maguire A, Moynihan PJ. Fluoride content of still bottled waters available in the North East of England, Uk. British Dental Journal. 2003; 195: 515-518.
CrossRef - Flaitz CM, Hill EM, Hicks MJ. A survey of bottled water usage by pediatric dental patient: implications for dental health. 1989; 20: 847-852.
- Farewell J, Bailey K, Chilton J, Dahi E, Farewell L, Magara Y. Fluoride in drinking water. A WHO publication. 2006; 134 pp. https // apps.who.int/iris/handle/10665/43513.???????
- Ahmed R, Hussain M, Tanwir R, Qureishi SA. Monitoring of Fluoride and iodide Levels in drinking water using ion selective electrode. TheNucleus (Islamabad). 2004; 41 (1-4): 51-58.
- Slooff W, Eerens HC, Janus JA, Ros JPM, Janssen PJCM, Knaap AGAC, Lagos P, Matthijsen AGCM, Reignders HFR, Strujs J, Wiel HJ van de. Basis Document Fluoriden. National institute of public health and environmental protection: Netherlands. 1988, 127: 89-93. Report No. 758474005.
- Wang Y. Nonlinear determination of the fluorine ion content in the water using ion selective electrode. Huaxue Fenxi Jiliang.2003;12(3):19-20.
- IPCS. Fluorine and Fluorides.Geneva,World Health Organization Internationalprogramme on chemical safety: Environmental health criteria 227. 1984.
- Janssen PJCM, Janus JA, Knaap AGAG. Integrated criteria document fluorides-effects. 1988. Appendix to RIVM-Report 758474005.
- IPCS. Fluoride Geneva, World health organization, International programme on Chemical safety: Environmental health criteria 227.Http//www.inchem.org/documents/ehc/ehc/ehc 227.htm. 2000.
- Maurer JK. Two-year carcinogenicity study of sodium fluoride in rats. Journal of the national cancer institute. 1990; 82: 1110-1126.
CrossRef - Edmonds WM, Smedley PL. Ground water geochemistry and health: an overview, environmental geochemistry and health with special reference to developing countries. British Geological Society Special publications. 1996; 113:91-105.
CrossRef - Maliykkal SM, Shukla S, Philip L, Nambie IM. Enhanced fluoride removal fromdrinking water by magnesia-amended activated alumina granules.Chemical engineering journal. 2008; 183-192.
CrossRef - Wang Ya-Nan, Xiao, K. Q., Liu, J. L., Dallner G. and Guan Z. Z. Effect of long time fluoride exposure on lipid composition in rat liver. Toxicology. 2000; 146(2-3): 161-169.
CrossRef - Armienta MA, Segovia. Arsenic in Fluoride in ground water of Mexico.Environmental Geochemistry and Health.2008; 30:345-353.
CrossRef - Encyclopedia Britannica, Lafia. 2006. Retrieved from :www. britannica.com/ place/Lafia on August 19, 2018.
- Sheshe MU, Magashi AM. Assessment of physicochemical quality of sachet water produced in selected local government areas of Kano metropolis, KANO STATE – NIGERIA, Bayero Journal of Pure and Applied Sciences. 2014; 7(2): 31 – 35.
CrossRef - Jian MS, Kar ML. Feasibility study on fluoride removal in drinking water in Mehsana. India International NGO Journal.2011; 6(10): 224-228.
- Kotecha P, Ratel S, Bhalahi K, Shah D, Shah V. Prevalence of dental fluorosis and caries in association with high levels of drinking water fluoride contents in district of Gujarat, India. Indian Journal of Medical Research. 2012; 135(6): 873-877.
- Brandao IMG, Valsecki-Junior A. Analise da concentracao de fluoriemaquas minerals naregiao de Araraquara-Brazil. Rev Panam Salud publica. 1998; 4(4): 238-242.
CrossRef - World Health Organization. Guideline for drinking-water quality. Recommendation, 2nd edition, W.H.O. Geneva. 2004; 23:375-377.
- Augustine UA, Ioryue SI, Simon AD. Determination of Fluoride Content of Selected Sachet Table Water Sold In Lafia Nasarawa State-Nigeria Using Potentiometric and Photometric Methods. Open Access Journal of Chemistry, 2019; 3:(2): 15-19.
CrossRef

This work is licensed under a Creative Commons Attribution 4.0 International License.