Performance Evaluation of Drinking Water Treatment Plant in Iraq
Hussain Mohammed Ali1,2* , Dheaa Zageer1,3  and Atheel H. Alwash1
1Department of Chemistry, College of Science, Al-Nahrain University, Baghdad, Iraq .
2Directorate Water of Karbala, Karbala Iraq .
3Forensic DNA Center for Research and Training, Al-Nahrain University, Baghdad, Iraq .
http://dx.doi.org/10.13005/OJPS04.01.05
The presence of natural or non-natural pollutants in water resulting from human activity such as the introduction of harmful agricultural and industrial pollutants into rivers that could be the main reason in forming trihalomethane compounds after chlorination step in drinking water production plants. Therefore, the objective of this paper was to assess the efficiency of traditional drinking water treatment plants in the removal of organic and inorganic pollutants (chemical and physical parameters). The Al-Hussein city water project as a traditional water treatment plant in Karbala governorate was taken with a capacity of 8000 m3/ has a model for this study. The physical and chemical properties of traditional plant was measured such as (Turbidity, Temperature, pH, Electric conductivity, Alkalinity, Total Hardness, Calcium, Magnesium, Chloride, Aluminum, Sulphate, Total dissolved salts) was taken from four units in the plant (quick mixing unit, sedimentation unit, filtration unit and disinfection unit). The average chemical and physical properties for both raw and drinking water were calculated for eight months during 2017-2018. The average removal percentage of turbidity was 60.7%. However, the values of the other tests ranged from 5 to -0.94%. In order to evaluate the presence of the organic substances in the plant. The samples for raw and drinking water were withdrawn in the winter and spring season from four units of the plant. The traditional plant show the removal efficiency of organic materials was 82% in the winter and 52% was in the spring season. The results showed that the physical and chemical properties were not significantly affected during the treatment process and their values were within the limits of the standard of drinking water. The traditional drinking water treatment plant considers unstable plant for the removal of organic compounds in the winter and spring with the possibility of forming chlorinated organic compounds. Therefore, there was the need to use additional treatment techniques to meet the challenges of new pollutants.
Copy the following to cite this article:
Ali H. M, Zageer D, Alwash A. H. Performance Evaluation of Drinking Water Treatment Plant in Iraq. Oriental Jornal of Physical Sciences 2019; 4(1)
DOI:http://dx.doi.org/10.13005/OJPS04.01.05Copy the following to cite this URL:
Ali H. M, Zageer D, Alwash A. H. Performance Evaluation of Drinking Water Treatment Plant in Iraq. Oriental Jornal of Physical Sciences 2019; 4(1). Available from: https://bit.ly/2MwE4z3
Download article (pdf) Citation Manager Publish History
Introduction
Pollution may be defined as the addition of undesirable material into the environment as a result of human activities, causes instability disorder, harm or discomfort to the ecosystem or living organisms. A pollutant may be defined as a physical, chemical or biological substance released into the environment which is directly or indirectly harmful to humans and other living organisms they are considered contaminants when they exceed natural levels.1 The commonly types of pollution are (Water pollution, Air pollution, Noise pollution, Radiation pollution, Soil pollution, Thermal pollution ).2 Water pollution is the introduction of undesirable substances or exposure to certain circumstances resulting in unacceptable it for human use.3 There are types of water pollution sources, the most important i) Organic pollutants ii) inorganic pollutants, the organic pollutants like (insecticides, herbicides, organ halides) and inorganic pollutants like (heavy metals, silt, burning, chemical waste from industrial effluents.4
There are many treatment units used to produce drinking water such as (coagulation and flocculation, sedimentation, filtration, disinfection, reverse osmosis, adsorption and ion exchange, advanced oxidation).5 The traditional drinking water plants involve several units and form the shape called “treatment train".6 Generally, the traditional drinking water plants have commonly units such as (coagulation and flocculation, sedimentation, filtration, disinfection). The efficiency of these plant for the removal of organic pollutants can be evaluated by GC-MS device, and other parameters of inorganic compounds can be evaluated the traditional plant such as (Turbidity, Temperature, pH, Electric conductivity, Alkalinity, Total Hardness, Calcium, Magnesium, Chloride, Aluminum, Sulphate, Total dissolve Slate). Water quality is a concept related to the chemical, and biological, physical, characteristics of water.7 The physical and chemical properties for drinking water must be within allowed limit, therefore, requires different processing techniques to reach these limits to the necessities of human needs or purposes.8 As such, the purpose of this research is to evaluate the efficiency of Al-Hussein city water project as a traditional water treatment plant in Karbala governorate for the removal of organic and inorganic pollutant.
Material, Equipment and Method
The materials used in this study are listed in the table (1) while table (2) provides information about the equipment used during the work.
Table 1: The materials used during the work
|
Chemicals |
formula |
Purity |
Supplier |
|
Hydrochloric Acid |
HCl |
37% |
Himedia Company |
|
Sulfuric acid |
H2SO4 |
95-98% |
Sigma-Aldrich |
|
Sodium Hydroxide |
NaOH |
99.9% |
Scharlau Company |
|
Hexane |
C6H14 |
99% |
Lab. chemistry department/ College of Science / Al. Nahrain university |
|
Diethyl Ether |
(C2H5)2O |
995% |
Lab. chemistry department/ College of Science / Al. Nahrain university |
|
Barium chloride |
BaCl2 |
99.99% |
Sigma-Aldrich |
|
Murexide |
C8H8N6O6 |
99.9% |
Sigma-Aldrich |
|
Ethylenediaminetetraacetic acid |
C10H16N2O8 |
99% |
Sigma-Aldrich |
Table 2: Equipment used in this study
|
Instruments |
Model |
Supplier |
|
Gas Chromatography-Mass spectrophotometer (GC-MS) |
GC-MS QP2010 Ultra |
Shimadzu Company |
|
Turbidimeter |
2100Q Portable |
HACH Company |
|
pH meter |
type 3320 |
Jenway Company |
|
Conductivity/TDS/Salinity Meter |
Senso Direct Con200 |
Lavibond Company |
Description of the work site
The water project of Al Hussein City was founded in 1985 and it was one of the most important projects in the holy city of Karbala with a capacity of 8000 m3/h. The project is based on traditional methods of filtering and sterilization. It is located several kilometers away from the Euphrates River and is surrounded by dense agricultural areas. The water is drawn from the Husseiniya River for the purpose of the producing drinking water. The project contains 2 quick mixing units working for mixing raw water with coagulation material, then after that the water distribution to the 8 sedimentation basins with a capacity of basins 1000 m3/h. In this step, the removing was for the large suspended molecules while the small suspended molecules will go to the all 40 filters with capacity of 200 m3/ h per one filter. After that the water go to the for disinfection unit (have a large size) to kill the bacteria by used chlorine with period (20-30min) as contact time. After that, the water becomes ready for human consumption and for the distribution. Figure (1) Aerial section of Google Maps shows the stages of treatment of water in the water project of the city of AL Hussein in Karbala.
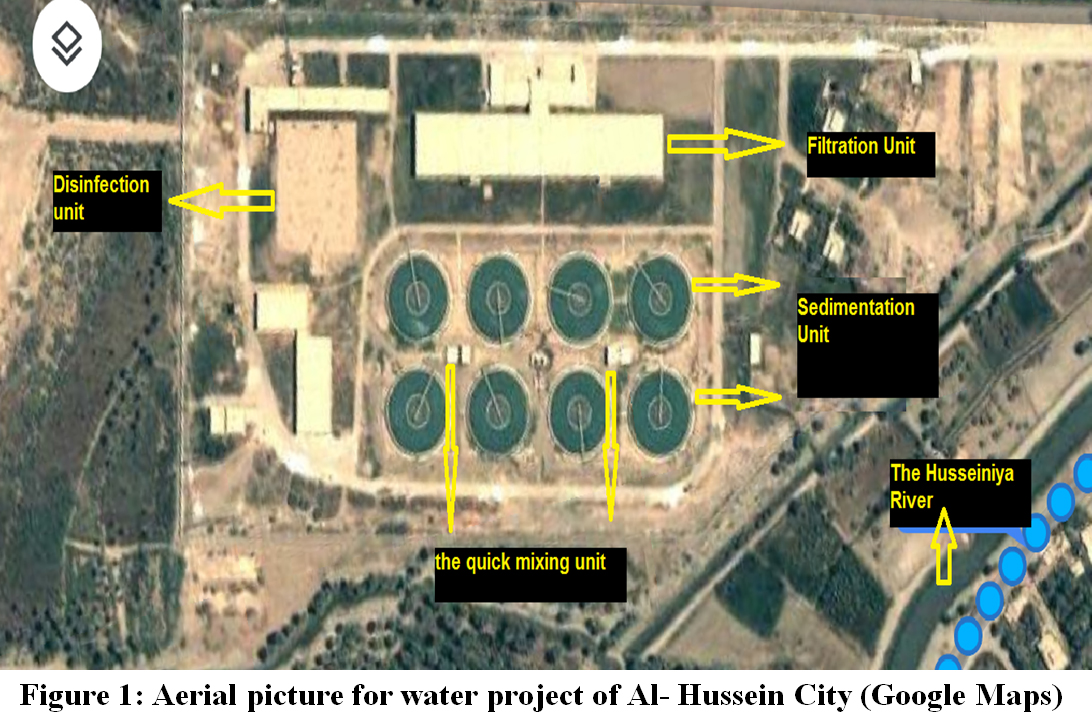 |
Figure 1: Aerial picture for water project of Al-Hussein City (Google Maps) |
Sampling
Water samples were withdrawn from AL-Hussein City water project for the purpose of conducting the following tests such as gas chromatography (GC-MS) and inorganic components. The sampling was repeated twice, for the first time it was for raw water and the produced water. Meanwhile, the second time includes the following locations (A) the quick mixing unit (B) the sedimentation unit (C) the filtration unit (D) the disinfection unit. Below the description of the containers used in withdrawn the samples from the river.
1-Glass container against sunlight (1 Liter) filled with water (taken from one large sample) for each time period. With a screw cap and TFE-faced silicone septum. If the sample was didn't analyze through 24h it was retained at 4C° until the analyzed time to ensure the organic compounds does no disintegrate to other compounds. These samples were used for the (GC-MS) test.
2- For inorganic models, the container used was glass or plastic bottles because these containers are made of stable materials and they do not give dissolved inorganic materials affecting the values of inorganic tests. In the modelling process, models of tap water were taken after a few minutes of opening tap water, as for the other sites, to ensure that the sample contains all the components present in the water. The sample is drawn from the size of three samples each sample pulled after five minutes.
Calculations
The average chemical and physical properties were calculated for specific periods of time by using Eq. 1. The removal percentage for many averages to the raw and drinking water was calculated by using Eq. 2 as below.
Where ∑ Xi is the total values of one parameter at different times, n the number of these parameters

Where R% is the removal percentage.
Results and Discussion
Water quality
Water quality is a concept related to the chemical biological and physical characteristics of water. The increase in the water components from the permissible limits and for the various uses causes actual health and economic damage. Table (3) represent set of instructions include the maximum permissible limits for the physical and chemical properties of organic and inorganic constituents for drinking water Issued the Central Agency for Standardization and Quality Control.9 If their values exceed the maximum permissible limit the water becomes polluted and has health and economic damage to humans.
Table 3: The physical and chemical properties limits for drinking water
|
1-Physical Properties |
3- Organic compound |
||
|
Properties |
Maximum allowed me/L |
Properties |
Maximum allowed mg/L |
|
Colour |
10 units |
Carbon tetrachloride |
0.004 |
|
Turbidity |
5 units |
Dichloromethane |
0.2 |
|
Taste |
Acceptable |
1,2 dichloroethane |
0.03 |
|
Odour |
Acceptable |
Benzene |
0.01 |
|
Acid function(PH) |
6.5 – 8.5 |
Toluene |
0.1 |
|
2- chemical properties |
Benzo-a-Pyrine |
0.0007 |
|
|
Properties |
Maximum allowed mg/l |
Monochlorobenzene |
0.3 |
|
As |
0.01 |
1,2 dichlorobenzene |
1.0 |
|
Cd |
0.003 |
1,4 dichlorobenzene |
0.3 |
|
Cr |
0.05 |
Trichlorobenzene |
0.02 |
|
CN |
0.03 |
Acrylamide |
0.0005 |
|
F |
1.0 |
Phenol |
0.002 |
|
Pb |
0.01 |
4- Pesticides |
|
|
Hg |
0.001 |
Type of pesticides |
Maximum allowed mg/l |
|
NO3 |
50 |
Aldrin/dieldrin |
0.00003 |
|
NO2 |
3 |
Atrazine |
0.002 |
|
Se |
0.01 |
Bentazone |
0.03 |
|
Al |
0.2 |
Carbofuran |
0.007 |
|
Cl |
350 |
D.D.T |
0.001 |
|
Cu |
1.0 |
Chlordane |
0.0002 |
|
CaCO3 |
500 |
Hexachlorobenzene |
0.001 |
|
Fe |
0.3 |
Isoproturon |
0.009 |
|
Mn |
0.1 |
Lindane |
0.002 |
|
Na |
200 |
Mcpa(clorophenoxy) |
0.002 |
|
TDS |
1000 |
Molinate |
0.006 |
|
SO4 |
400 |
Pendimethalin |
0.02 |
|
Zn |
3 |
Permethrin |
0.02 |
|
Ca |
150 |
Propanil |
0.02 |
|
Mg |
100 |
Simazine |
0.002 |
|
Ba |
0.7 |
Trifluralin |
0.02 |
|
Ni |
0.03 |
|
|
|
B |
0.5 |
|
|
Evaluation of the plant from the presence of organic matter
The presence of organic materials in the water of the project was studied by the technique of gas chromatography-mass spectrometry. In order to evaluate the removal of organic materials in the water project of Al- Hussain city. The samples were withdrawn during two periods i.e. 9/1/2018, the samples were withdrawn for raw water and water produced, but on 24/4/2018, the samples were withdrawn from the sites (quick mixing unit, sedimentation unit, filtration unit, disinfection unit). The samples withdrawn during January and April were extracted by hexane and hexane-diethyl ether. The organic layer (containing the dissolved organic matter) was withdrawn in each case and analyzed by (Shimadzu GC-MS. QP2010 Ultra). Figure (2) represents the analysis from GC/MS in January and the compounds produce from chromatogram were recorded in the table (4). The results show the presence of the phenol in raw water and drinking water, the maximum number of remained compounds was 11 and the minimum number of remained compounds was 2 with removal efficiency was 82%.
Although Al-Hussain city project could remove some organic compounds the plant could not remove the phenol from the water. The phenol is considered a toxic and dangerous compound.10 Thus, it must be removed from the water. The samples withdrawn during April were extracted by hexane-diethyl ether and analyzed by GC-MS as in figures (3,4,5,6) and tables (5,6,7 and 8). Generally, the result from the GC-MS analysis shows many hydrocarbon compounds remained at all treatment units. The maximum number of remained compounds was 23 and the minimum number of remained compounds was 11. Therefore, the removal efficiency of the plant was approximately 52% for all units. This means that trihalomethane compounds may be high after disinfection.11 This problem requiring the development of new treatment technologies for the removal of organic matter.
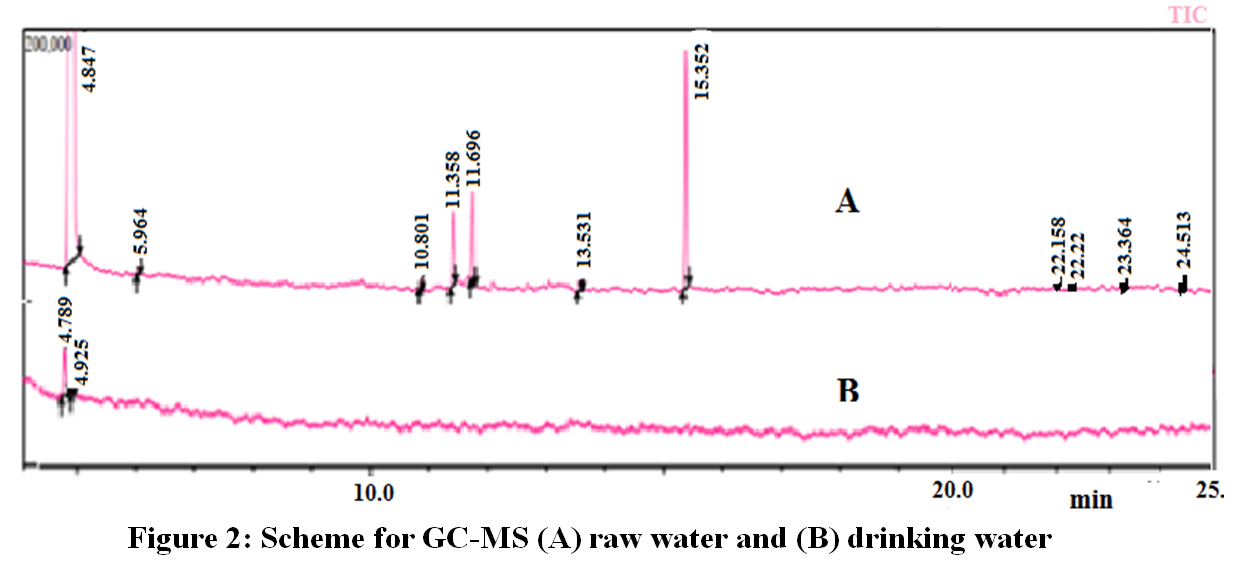 |
Figure 2: Scheme for GC-MS (A) raw water and (B) drinking water |
Table 4: Different compounds in raw water and drinking water
|
Compounds for scheme (A) raw water |
|||
|
Peak |
Retention time |
Area % |
Name |
|
1 |
4.847 |
94.65 |
Phenol |
|
2 |
5.964 |
0.09 |
Phenol, 2-methyl- (CAS) |
|
3 |
10.801 |
0.08 |
Pentane, 3-bromo- (CAS) |
|
4 |
11.358 |
0.82 |
Propanoic acid, 2-methyl-, 2,2- |
|
5 |
11.696 |
1.03 |
Propanoic acid, 2-methyl-, 3-hy |
|
6 |
13.531 |
0.15 |
Butyric acid, neopentyl ester |
|
7 |
15.352 |
2.57 |
Pentanoic acid, 2,2,4-trimethyl |
|
8 |
22.158 |
0.16 |
11,14-Eicosadienoic acid, meth |
|
9 |
22.22 |
0.05 |
9-Octadecenoic acid (Z)-, meth |
|
10 |
23.364 |
0.1 |
TRICOSANE |
|
11 |
24.513 |
0.16 |
Nonadecane (CAS) |
|
Compounds for scheme(B) drinking water |
|||
|
Peak |
Retention time |
Area % |
Name |
|
1 |
4.789 |
94.58 |
phenol |
|
2 |
4.925 |
5.42 |
Acetic acid, phenyl ester (CAS) |
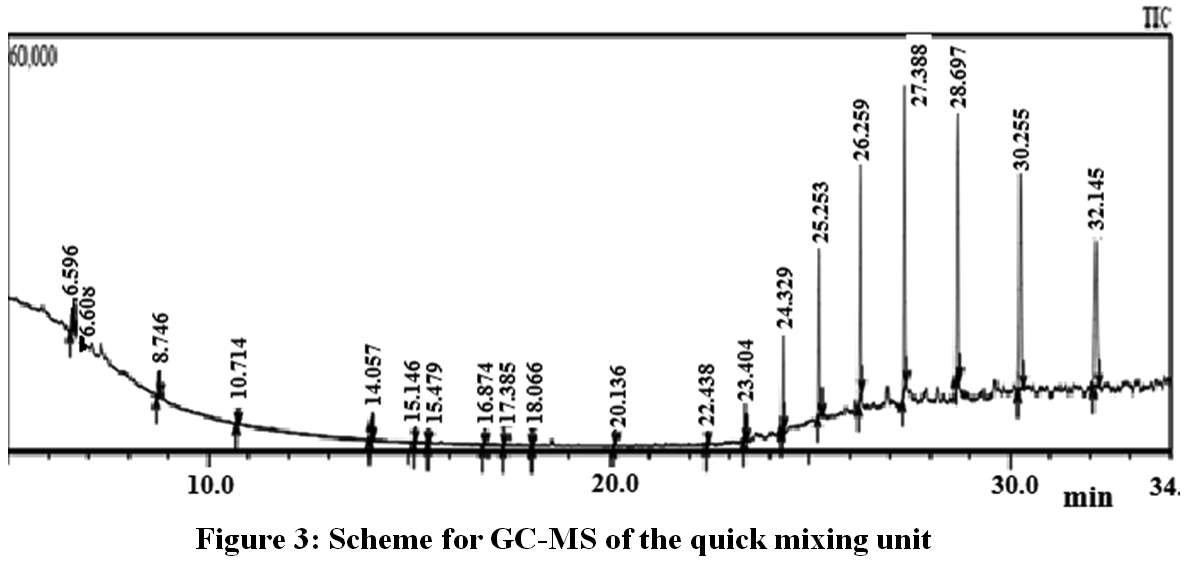 |
Figure 3: Scheme for GC-MS of the quick |
Table 5: Different compounds of the quick mixing unit
|
Compounds from figure (2) the quick mixing unit |
|||
|
Peak |
Retention time |
Area % |
Name |
|
1 |
6.596 |
1.5 |
Tetradecane, 2,6,10-trimethyl- (CAS) |
|
2 |
6.608 |
0.01 |
Tetradecane, 2,6,10-trimethyl- (CAS) |
|
3 |
8.746 |
1.2 |
Dodecane (CAS) |
|
4 |
10.714 |
0.61 |
Tricosane (CAS) |
|
5 |
14.057 |
1.36 |
1 H-1,2,3-Triazole(CAS) |
|
6 |
14.057 |
0.69 |
2- Hepten-3-ol, 4,5-dimethyl- (CAS) |
|
7 |
15.146 |
0.65 |
1-Pentadecanol(CAS) |
|
8 |
15.479 |
0.04 |
Propanoic acid, anhydride (CAS) |
|
9 |
16.874 |
0.07 |
2-Benzylidene-3-oxo-4-(octylsulfanyl)-2,3- |
|
10 |
17.385 |
0.02 |
TRANS-.BETA.-IONON-5,6-EPOXIDE |
|
11 |
18.066 |
0.04 |
tert-Butyl 2-hydroxypropylcarbamate |
|
12 |
20.136 |
0.18 |
7,7-Dimethyl-1-trimethylsilylocta-1,3-diyn-5- |
|
13 |
22.438 |
0.52 |
Pentadecane (CAS) |
|
14 |
23.404 |
1.9 |
Eicosane (CAS) |
|
15 |
24.329 |
4.71 |
Docosane (CAS) |
|
16 |
24.329 |
4.88 |
Docosane (CAS) |
|
17 |
25.253 |
8.51 |
Tetratetracontane (CAS) |
|
18 |
26.259 |
12.02 |
Tetracontane |
|
19 |
27.388 |
15.57 |
Tetracontane |
|
20 |
28.697 |
13.51 |
Tetrapentacontane |
|
21 |
28.697 |
13.51 |
Tetrapentacontane |
|
22 |
30.255 |
11.06 |
Tetrapentacontane |
|
23 |
32.145 |
7.44 |
Tetrapentacontane |
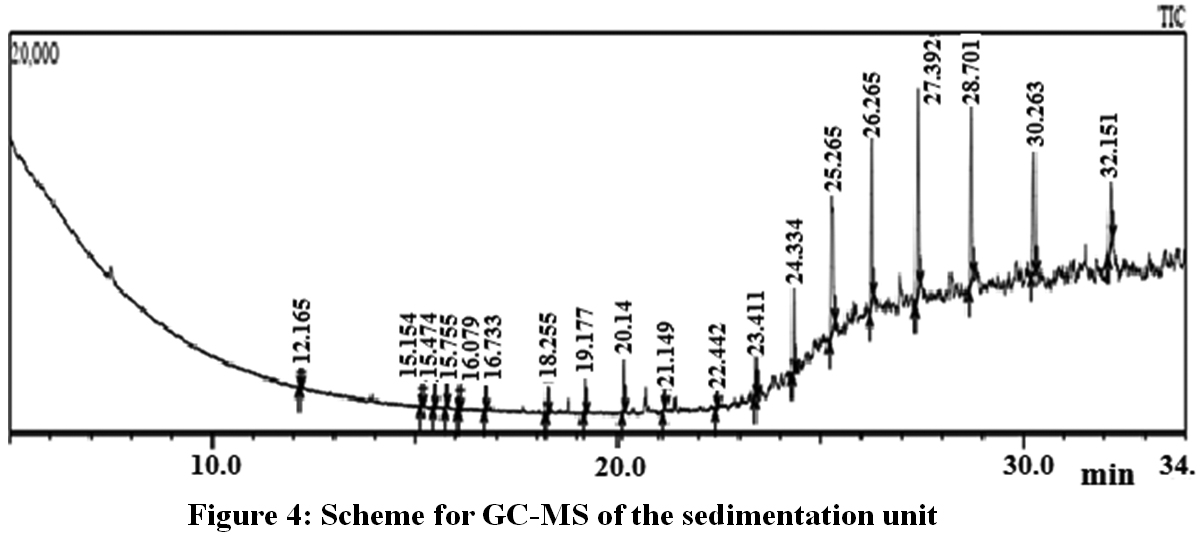 |
Figure 4: Scheme for GC-MS of the |
Table 6: Different compounds of the sedimentation unit
|
Compounds from Figure (4) of the sedimentation unit |
|||
|
Peak |
Retention time |
Area % |
Name |
|
1 |
12.165 |
0.47 |
-- |
|
2 |
15.154 |
0.53 |
1-Pentadecanol (CAS) |
|
3 |
15.474 |
1.35 |
Hexadecane, 1-iodo- (CAS) |
|
4 |
15.755 |
1.77 |
2-tert-Butyl-4-(2,4,4-trimethylpent-2-yl)phenol |
|
5 |
16.079 |
0.56 |
7-Oxanonadecane |
|
6 |
16.733 |
1.64 |
1-Hexadecanol (CAS) |
|
7 |
18.255 |
1.51 |
Nonadecane (CAS) |
|
8 |
19.177 |
1.67 |
7-Hexadecene, (Z)- (CAS) |
|
9 |
20.14 |
3.2 |
1,2-Benzenedicarboxylic acid, bis(2-methylprop |
|
10 |
21.149 |
0.84 |
Hexadecane, 1-iodo- (CAS) |
|
11 |
22.442 |
0.86 |
Pentadecane (CAS) |
|
12 |
23.411 |
2.3 |
Eicosane (CAS) |
|
13 |
24.334 |
4.53 |
Docosane (CAS) |
|
14 |
25.263 |
17.94 |
Tetratetracontane (CAS) |
|
15 |
26.265 |
11.96 |
Tetracontane |
|
16 |
27.392 |
15.53 |
Tetracontane |
|
17 |
28.701 |
15.61 |
Tetrapentacontane |
|
18 |
30.263 |
12.09 |
Tetrapentacontane |
|
19 |
32.151 |
5.6 |
Tetrapentacontane |
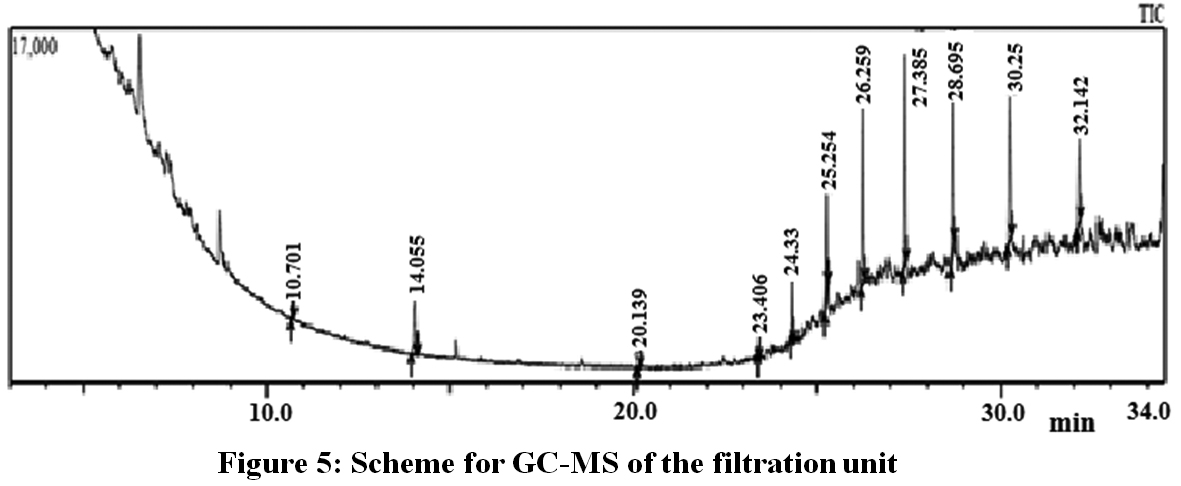 |
Figure 5: Scheme for GC-MS of the filtration unit |
Table 7: Different compounds of filtration unit
|
Compounds from Figure(5)of the filtration unit |
|||
|
Peak |
Retention time |
Area % |
Name |
|
1 |
10.701 |
1.12 |
Tricosane (CAS) |
|
2 |
14.055 |
7.48 |
1H-1,2,3-Triazole (CAS) |
|
3 |
20.139 |
0.66 |
7,7-Dimethyl-1-trimethylsilylocta-1,3-diyn-5-e |
|
4 |
23.408 |
1.02 |
Eicosane (CAS) |
|
5 |
24.33 |
3.96 |
Docosane (CAS) |
|
6 |
25.254 |
7.35 |
Tetratetracontane (CAS) |
|
7 |
26.259 |
14.97 |
Tetracontane |
|
8 |
27.385 |
18.89 |
Tetracontane |
|
9 |
28.695 |
17.18 |
Tetrapentacontane |
|
10 |
30.25 |
17.25 |
Tetrapentacontane |
|
11 |
32.142 |
10.12 |
Tetrapentacontane |
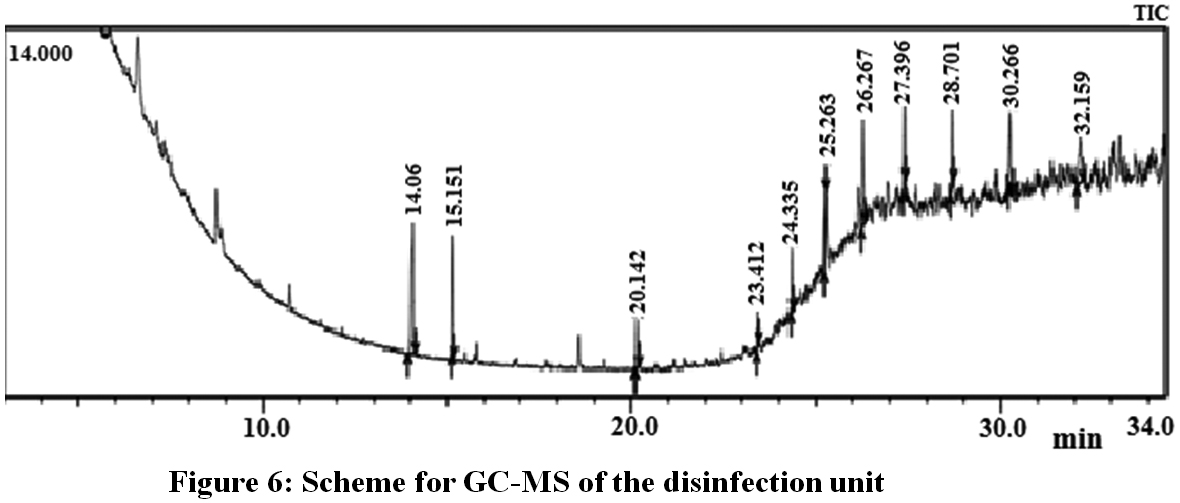 |
Figure 6: Scheme for GC-MS of the |
Table 8: Different compounds of disinfection unit
|
Compounds from Figure(6) of the disinfection unit |
|||
|
Peak |
Retention time |
Area % |
name |
|
1 |
14.061 |
19.87 |
2-Hepten-3-ol, 4,5-dimethyl- (CAS) |
|
2 |
15.151 |
10.62 |
1-Dodecanol (CAS) |
|
3 |
20.142 |
4.45 |
1,2-Benzenedicarboxylic acid, bis(2-methylpro |
|
4 |
23.412 |
3.06 |
Eicosane (CAS) |
|
5 |
24.335 |
5.59 |
Docosane (CAS) |
|
6 |
25.263 |
4.28 |
Tetracontane |
|
7 |
26.267 |
11.57 |
Tetracosane (CAS) |
|
8 |
27.396 |
9.18 |
Tetrapentacontane |
|
9 |
28.701 |
9.52 |
Tetrapentacontane |
|
10 |
30.266 |
10.6 |
Tetrapentacontane |
|
11 |
32.159 |
11.25 |
Tetrapentacontane |
Evaluation of Inorganic Substances
in January/2018 water, samples were withdrawn from the Al-Hussein City project. The sampling was of four treatment units and the experiments were carried out in the quality control laboratories affiliated to the Ministry of Housing Municipalities and Public Works. The values of inorganic properties were recorded in the table (9). It was noticed that the sedimentation unit does not have any effect on the treatment process due to the low turbidity level. As such, the coagulant material is not adding to the raw water except when the turbidity values rise. On the other hand, high values of (TDS, EC, CL, TH) were observed at the last treatment unit, due to the addition of chlorine which leads to an increase of salts, while we find an increase in (turbidity, SO4, Ca) due to the media of filtration unit that is not effective or, the media of the filtration unit were slightly dissolving in water. Although the changes in the physical and chemical properties values during the treatment units are few, these values fall within the limits of the Iraqi standard because the values of the components of the Euphrates River basically fall within these limits.
Table 9: Values of inorganic chemical and physical properties of treatment units
|
Parameter mg/L |
Raw water (Assembly Unit) |
Before filter (Sedimentation unit) |
After filter (filter unit) |
Clean water (chlorination unit) |
The limits of the standard |
|
Turbidity, NTU |
1.35 |
1.3 |
1.47 |
1.47 |
5 |
|
Temperature T |
20 |
20 |
20 |
20 |
25 |
|
PH |
7.88 |
8.2 |
8.2 |
7.83 |
6.5- 8.5 |
|
E.C, µs/cm 25 C |
1118 |
1118 |
1125 |
1129 |
---- |
|
Alkalinity (asCaCO3) |
132 |
132 |
132 |
128 |
125 - 200 |
|
Total hardness (as CaCO3) |
366 |
360 |
368 |
371 |
500 |
|
Calcium (as Ca ) |
84 |
84 |
87 |
87 |
150 |
|
Magnesium (as Mg) |
38 |
38 |
38 |
37 |
100 |
|
Chloride (as Cl) |
124 |
124 |
124 |
128 |
350 |
|
Aluminum (as Al) |
0 |
0 |
0 |
0 |
0.2 |
|
Sulphate (as So4) |
255 |
243 |
255 |
259 |
400 |
|
T.D.S |
698 |
698 |
705 |
706 |
1000 |
Evaluation of the project between 2017-2018
The physical and chemical tests in the water project were monitored for AL- Hussein city between 2017-2018 and the tests included, raw water and drinking water for the purpose of evaluating the efficiency of removal of inorganic materials in the project. The tests were cooperation with the Quality Control Laboratory in Karbala and the results were recorded in the tables (10 and 11) respectively. The average values of all parameters were calculated using eq. (1) and the removal efficiency %were calculated for both raw and drinking water using eq (2).
Table 10: parameter value for raw water between 2017- 2018
|
Months |
Tub |
TH |
Alk |
T.D.S |
pH |
CI |
Ca |
Mg |
E.C |
Na |
K |
SO4 |
|
Oct-17 |
8 |
347 |
106.5 |
671 |
7.8 |
108 |
81.7 |
35 |
1050.5 |
83.7 |
4.6 |
260 |
|
Nov-17 |
8.6 |
364 |
114.6 |
692.6 |
7.7 |
114 |
83.6 |
38 |
1081 |
84 |
4.7 |
271 |
|
Dec-17 |
6.6 |
376 |
118 |
700 |
7.9 |
121.6 |
89 |
37 |
1094.6 |
90 |
4.4 |
284.6 |
|
Jan-18 |
6.5 |
370 |
124 |
702 |
8 |
123.5 |
88 |
36.5 |
1102 |
84 |
4.35 |
259.5 |
|
Feb-18 |
8.2 |
346 |
125.5 |
701 |
8 |
131.5 |
82 |
33.5 |
1102.5 |
96.7 |
4.12 |
236.7 |
|
Mar-18 |
9.6 |
386.6 |
121 |
686.6 |
7.9 |
115.6 |
100.6 |
32.6 |
1089.6 |
84 |
4.2 |
252 |
|
Apr-18 |
8.7 |
381 |
123.5 |
689.5 |
7.9 |
108.5 |
101.7 |
31 |
1093.7 |
79 |
3.9 |
268 |
|
May-18 |
8 |
367 |
128 |
668 |
7.9 |
121 |
96 |
30.8 |
1059.8 |
90 |
4.5 |
255 |
|
Average |
8.025 |
367.2 |
120.1 |
688.8 |
7.8 |
117.9 |
90.3 |
34.3 |
1084.2 |
86.4 |
4.3 |
260.8 |
Table 11: parameter value for drinking water between 2017- 2018
|
Months |
Tur |
TH |
Alk |
T.D.S |
pH |
CI |
Ca |
Mg |
E.C |
Na |
K |
SO4 |
|
Oct-17 |
3.7 |
343 |
104.5 |
667.5 |
7.5 |
109.7 |
80 |
34.7 |
1044.7 |
82 |
4.4 |
262 |
|
Nov-17 |
3.6 |
360 |
112.6 |
688 |
7.6 |
116 |
82 |
37.6 |
1075.6 |
83.6 |
4.5 |
273 |
|
Dec-17 |
1.5 |
372 |
116.6 |
707 |
7.8 |
123 |
88 |
37 |
1105 |
88.6 |
4.13 |
288 |
|
Jan-18 |
3 |
366 |
122 |
699 |
7.8 |
125 |
86 |
36.5 |
1101 |
83 |
3.7 |
259.5 |
|
Feb-18 |
3.25 |
341 |
123.5 |
695 |
7.9 |
134 |
81 |
33 |
1093 |
95 |
4 |
239 |
|
Mar-18 |
3.9 |
384 |
119 |
691 |
7.7 |
117 |
99 |
33 |
1097 |
84 |
4.13 |
255 |
|
Apr-18 |
3.5 |
377 |
121.5 |
690 |
7.8 |
110 |
100.7 |
30.5 |
1094.5 |
77.7 |
3.7 |
272 |
|
May-18 |
2.8 |
362 |
126 |
667.6 |
7.8 |
124.8 |
95 |
30.6 |
1059 |
88.6 |
4.4 |
258 |
|
average |
3.1 |
363.1 |
118.2 |
688.1 |
7.7 |
119.9 |
88.9 |
34.1 |
1083.7 |
85.3 |
4.12 |
263.3 |
The results of removal efficiency% to the different inorganic tests resulting from the average values of the raw and drinking water depended on eq. (2) was recorded in the table (12). The removal efficiency % of turbidity was 60.7 % which consider the highest value comparing to other values of the removal efficiency % that was between (5.2) to (-0.94) and these values is very low. The chlorine values were ignored since the chlorination is in the final stage of the treatment process. The presence of chlorine in water is a desirable process, and the raw water does not contain chlorine until subtract from drinking water. The negative value of sulphate indicates that alum is added to the raw water, thus giving an extra dose of sulfate to the water product instead of the raw water. The results appear the traditional treatment plant, was not able to remove different inorganic parameters and can use this plant only for removal turbidity%
Table 12: Average values of raw water and treated water
|
Parameter |
Average raw |
Average treated |
R% |
|
Turbidity |
8.03125 |
3.15625 |
60.7 |
|
Hardness |
367.2 |
363.125 |
1.1 |
|
Alkalinity |
120.1375 |
118.2125 |
1.6 |
|
T.D.S |
688.8375 |
688.1375 |
0.1 |
|
pH |
7.8875 |
7.7375 |
1.9 |
|
Ca |
90.325 |
88.9625 |
1.5 |
|
Mg |
34.3 |
34.1125 |
0.54 |
|
E.C |
1084.2125 |
1083.725 |
0.04 |
|
Na |
86.425 |
85.3125 |
1.28 |
|
K |
4.34625 |
4.12 |
5.2 |
|
SO4 |
260.85 |
263.3125 |
-0.94 |
Conclusion
Al -Hussein Water Project is one of the traditional filter plants proved efficiency removal of organic compounds up to 82% in the winter season and 52% in the spring season. Thus, the possibility of the formation of trihalomethane after chlorination was high. The physical and chemical properties were not significantly affected during the treatment process through calculate the efficient removal of the average chemical and physical properties to raw and produced water for eight months’ period during 2017 2018, and the removal percentage of turbidity was 60.7%. Meanwhile, the other tests values ranged from (5) to -0.94%. The results showed that the physical and chemical properties were not significantly affected during the treatment process. The conventional drinking water treatment plant proved to be variable in the removal of organic compounds in the winter and spring with the possibility of forming chlorinated organic compounds, generally on filtration and disinfection only. Therefore, the use of additional processing techniques is required to meet the challenges of new pollutants
Acknowledgements
First and foremost, I would like to thank Allah. And I would like also to express my deepest thanks and appreciation to my supervisor, Dr. Dheaa Shamikh Zageer and Dr. Atheel H. Alwash to propose this research, guidance and advice during the working period. I also thank the staff of the Chemistry Department for their efforts and cooperation with me, as well as thanks to the Directorate of Water Karbala for facilitating the approval of the study.
References
- Njeruh P. F. M., “WATER POLLUTION,” BSC. Fish. Aquac. Manag., 2010; p. 1.
- Slattery M., “Contemporary Environmental Issues (Module - 4),” Environ. SSS Course, 2012; p. 165.
- Owa F. W., “Water pollution : sources, effects, control and management,” Int. Lett. Nat. Sci., 2014; vol. 3, no. 1: pp. 1–6.
CrossRef - Gupta A., “Water Pollution-Sources, Effects and Control Water Pollution-Sources, Effects and Control,” no. November, 2017.
- David B. Hand W., Ph.D., principles of water treatment. 2012.
- Angreni E., “Review on Optimization of Conventional Drinking Water Treatment Plant,” World Appl. Sci. J., 2009; vol. 7, no. 9: pp. 1144–1151.
- Davies-Colley R. J., “River water quality in New Zealand: an introduction and overview,” Ecosyst. Serv. New Zeal. Cond. trends. Manaaki Whenua Press. Lincoln, 2013; pp. 432–447.
- Li P., “Abbasi T and Abbasi SA: Water Quality Indices,” Environ. Earth Sci., 2014; vol. 71, no. 10: pp. 4625–4628.
CrossRef - C. agency for standardization and Quality Control, “Iraqi standard specification for drinking water(Second Update),” 2010.
- Akbal F., “Sorption of phenol and 4-chlorophenol onto pumice treated with cationic surfactant,” J. Environ. Manage., 2005; vol. 74, no. 3: pp. 239–244.
CrossRef - Guyo U., and Moyo M., “Determination of Trihalomethanes in Raw and Treated Water Supply to a Local City in Zimbabwe,” Int. J. Eng. Res. Technol., 2013; vol. 2, no. 2: pp. 1–7.

This work is licensed under a Creative Commons Attribution 4.0 International License.