Estimation of Aquifer Characteristics in Parts of Oru Lga of Imo State Nigeria Using Resistivity Data
Agbodike I.I.C.1*
1Department of Physics, Imo State University, Owerri, Nigeria .
http://dx.doi.org/10.13005/OJPS04.02.07
Copy the following to cite this article:
Agbodike I. I. C. Estimation of Aquifer Characteristics in Parts of Oru Lga of Imo State Nigeria Using Resistivity Data. Oriental Jornal of Physical Sciences 2019; 4(2).
DOI:http://dx.doi.org/10.13005/OJPS04.02.07Copy the following to cite this URL:
Agbodike I. I. C. Estimation of Aquifer Characteristics in Parts of Oru Lga of Imo State Nigeria Using Resistivity Data. Oriental Jornal of Physical Sciences 2019; 4(2). Available from: https://bit.ly/35IgfKd
Download article (pdf) Citation Manager Publish History
Introduction
Aquifer hydraulic parameters are properties that control the movement, storage and extraction of underground water.11 Assessment of the groundwater potentials of any area cannot be complete without the estimation of these parameters. This paper estimates aquifer characteristics in parts of Oru Area Imo State of South Eastern Nigeria using data from surface electrical soundings. The superiority of the electric method over others in groundwater research is confirmed by the work of (16). (22) and (23) reported on the ability of the resistivity method to furnish information on the subsurface geology unobtainable by other methods in the groundwater studies. For example they attested to the ability of the resistivity method to provide information on the depth of the fresh water/salt water interface.The geoelectrical method has been successfully utilized in accessing water supply potential in basement aquifers (4) and the assessment of the groundwater resource potential within the obudu basement area of Nigeria (13).(11) carried out a study for the determination of aquifer characteristics in parts of Umuahia area of Nigeria using the geoelectric method. Also(8) using the geoelectrical method produced the groundwater flow modeling of kwa-Ibo river water shed in southeastern Nigeria.
Aquifer characteristics presented in this paper include aquifer depths, aquifer thicknesses, transverse resistance, longitudinal conductance and aquifer resistivity .Aquifer hydraulic parameters are estimated for any given aquifer system in order to obtain quantitative information on groundwater flow. it is a standard practice to estimate aquifer hydraulic parameters using Dar-Zarrock parameters of transverse resistance and longitudinal conductance14 High values indicates that the material is permeable, while low value indicates that the material is impermeable. (7),(19).(20) have successfully estimated aquifer hydraulic characteristics from Dar-zarouk parameters in many parts of Southeastern Nigeria from surface electrical resistivity sounding data.
When electrical current flows parallel to the geoelectrical boundaries, the parameter that influences current flow is the longitudinal conductance ,S and when the current flows normal to the bed boundaries,the transverse resistance ,T is significant.6Longitudinal conductance is one of the geoelectric parameters used to determine target areas of groundwater potential. Low transverse resistance values are associated with low resistivity formations(such as clayey soil). Higher Transverse resistance values are characteristic of high resistivity formations(6) Also from transverse resistance values ,it is possible to determine the direction ofground water flow in the aquifer(6). The S and T values are also known as Dar-zarrouk parameters(12) and for a layer of thickness h and resistivity р are defined as
S= h/Ñ€ (1)
T =hр (2)
Location and Geomorphology of the Study Area
The study area consists of some communities located within the Oru Area of Imo-State Nigeria. The increasing population in Oru which is over two hundred and twenty nine thousand according15 and consequent increasing demand for portable water prompted the present search for favourable groundwater potential zones in the area. Besides, this paper aims at providing a quantitative information about the ground water potential in this area so as to contribute to any future water resources management program for this region. The study area lies between longitude 6050E and 7000E and latitude 5050N and 5037N as shown in the location map of the Area as in figure 1. It covers a land mass of about 315 km2 South East Nigeria.
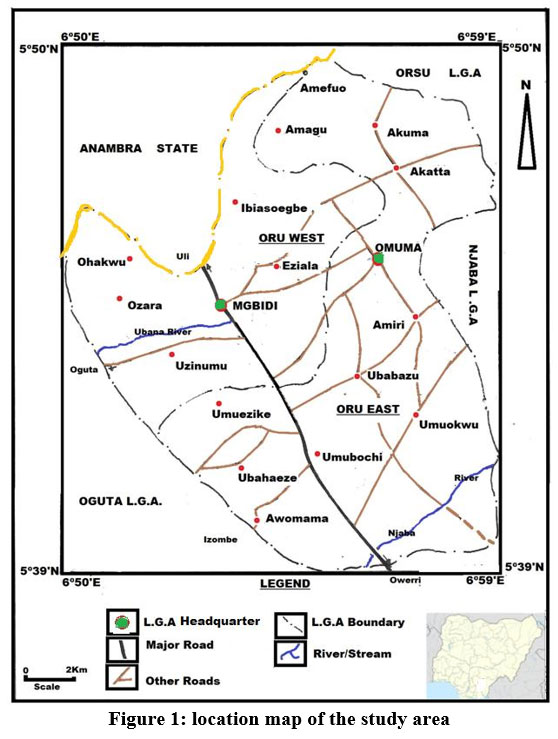 |
Figure 1: location map of the study area Click here to view Figure |
Geology and Hydrogeology of the Area
The Oru Area is made up of two geological formations; the Ogwashi-Asaba and the Benin formation which was formerly known as coastal plain sands (17). Ogwashi-Asaba formation is characterized by alternation of clays and sands, grits and lignites(5). (17) suggested Oligocene-Miocene age for this formation. For the Benin formation, the sands and sandstones are coarse to fine grained and commonly of granular texture. The formation consists of friable sand with intercalations of shale and clay lenses occurring occasionally at some depths(18). The formation is partly estuarine, partly lagoon, partly deltaic and fluvid, lacustrine in origin(17). The sands and sandstone in this formation are coarse grained, very granular, pebbly to very fine grained. They are either white in colour or yellowish brown. Hematite grains and feldspars are also obtained. The shale are grayish brown, sandy to silty and contains some plant remains and dispersed lignites.17 The formation has an average thickness of 600ft (196.85m).10
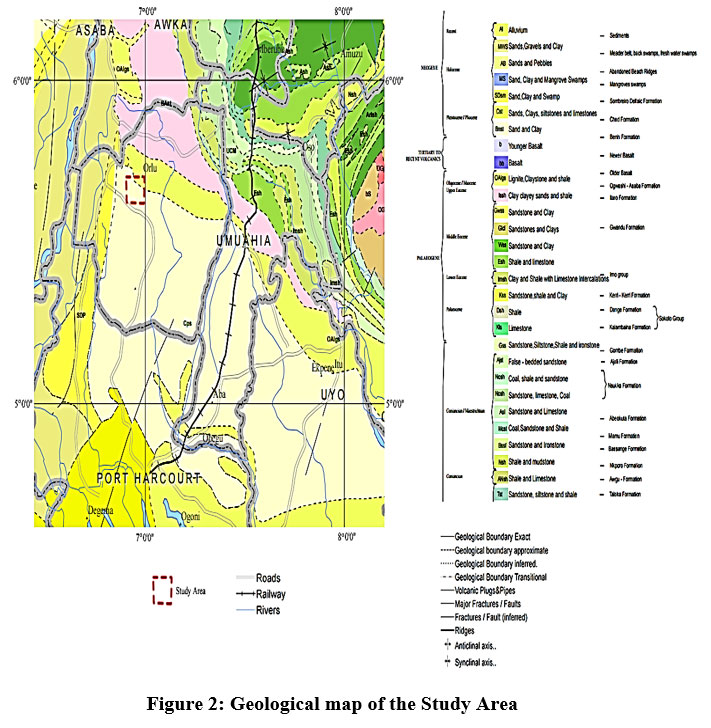 |
Figure 2: Geological map of the Study Area Click here to view Figure |
Surface waters are not a major feature of the Oru Area. The Njaba and Obana rivers seem to be the only surface waters in the area.1 The two formations are known to have reliable groundwater that could sustain borehole production. The high permeability of the coastal plain sands, the overlying lateritic earth and the weathered top of this formation provide the hydraulic conditions favouring aquifer formation in the study area. The copious rainfall that prevails in the area makes the aquifer prolific and continuously provides the ground water recharge. The geological map of the area is in figure 2.
Data Acquisition and Interpretation
Eighteen vertical electrical soundings were made in the study area using a maximum current electrode separation of 1.0km. The ABEM terrameter SAS 3000B was used in acquiring data while four metal stakes were used as electrodes. The schlumberger electrode configuration was adopted in this survey. In this array the current and potential electrode pairs have a common midpoint but the distances between adjacent electrodes differ significantly. For a schlumberger spread, the apparent resistivity computed from the measurement of voltage, DV and the current I is given by the equation
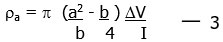
Theoretically, the resistivity (r) of a material is directly proportional to the potential difference (V) and inversely proportional to the induced current I (11)
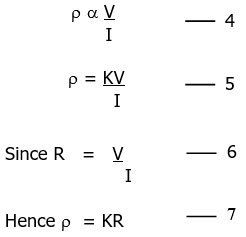
Where K is the geometric factor, R is the resistance.
The geometric factor K depends on the electrode separation. R is the resistance of the volume of ground between the potential electrodes. If V and I are measured in milli-volts and milli-amperes respectively and the distance of separations in meter, then the resistivity r is expressed in Ohm-meter. The apparent resistivity values obtained from the field were plotted against half the current electrode spacing (AB/2) on a bi-logarithmic graph for all the VES stations. The computer modeling delineated 6-7 geoelectric layers. The computer program RESIST designed and used in the National Geophysical Research Institute (NGRI) by [9], Hyderabad India were employed in the interpretation of the VES data. The output of the Resist software comprises a best fit curve or computer modeled curve, a set of resistivity values with corresponding layer thickness, total probe depth and the fitting error in percentage. Some of the resistivity curves obtained in the area are plotted in fig. 3, fig. 4 and fig. 5. Also the layer parameters from the resistivity soundings are shown in table2 while table 1 displays aquifer conductivity, Transverse resistance and longitudinal conductance. The depth to water table varied from 27m to about 205m. Aquifer thickness varied from 24m to about 140m and the aquiferous zones have resistivity range of between 182 ohm-m to about 3934ohm-m. The spatial variation of aquifer depth in the study area is shown in figure…6.
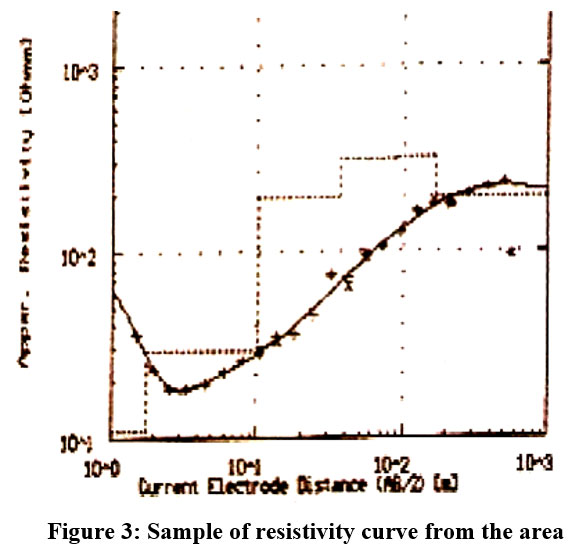 |
Figure 3: Sample of resistivity curve from the area Click here to view Figure |
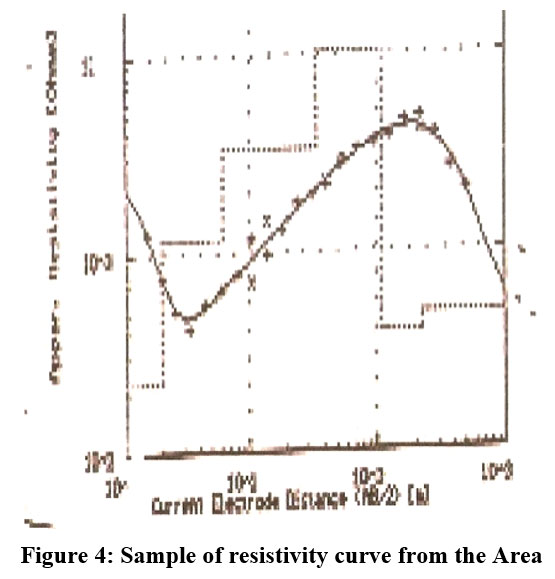 |
Figure 4: Sample of resistivity curve from the Area Click here to view Figure |
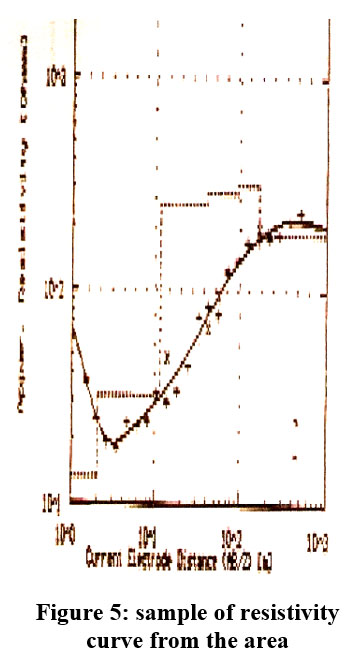 |
Figure 5: sample of resistivity curve from the area Click here to view Figure |
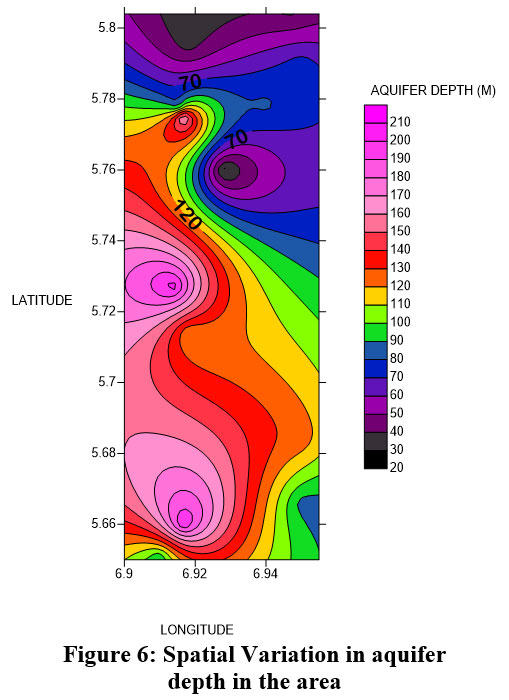 |
Figure 6: Spatial Variation in aquifer depth in the area Click here to view Figure |
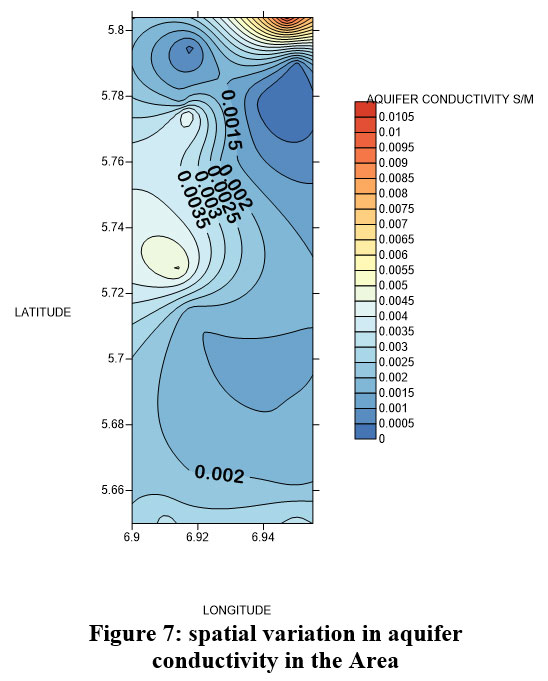 |
Figure 7: spatial variation in aquifer conductivity in the Area Click here to view Figure |
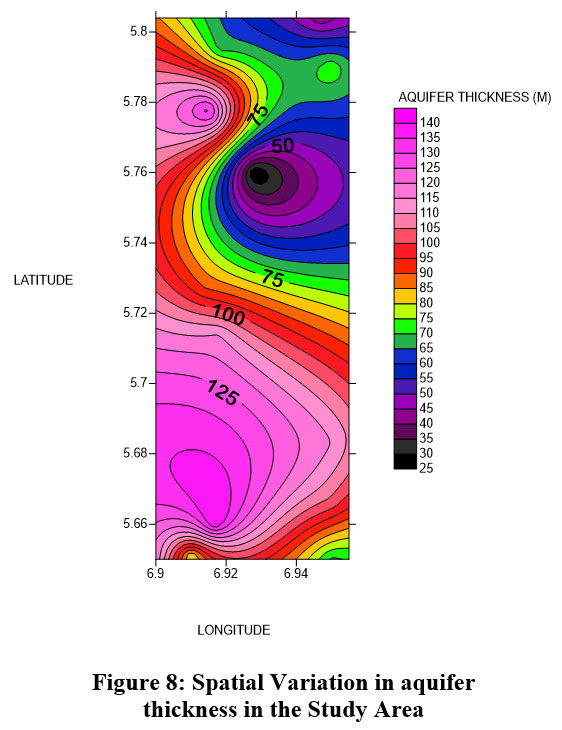 |
Figure 8: Spatial Variation in aquifer thickness in the Study Area Click here to view Figure |
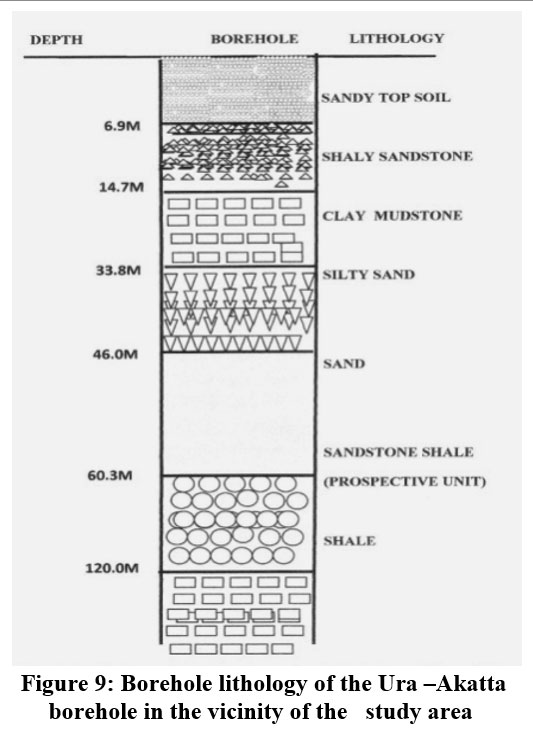 |
Figure 9: Borehole lithology of the Ura –Akatta borehole in the vicinity of the study area Click here to view Figure |
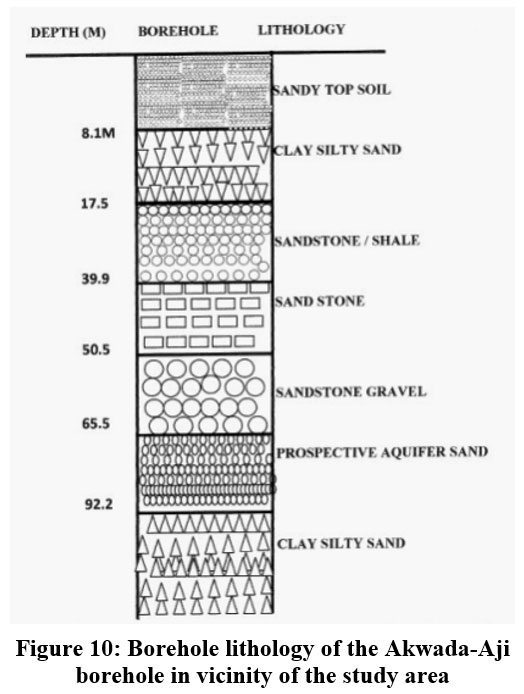 |
Figure 10: Borehole lithology of the Akwada-Aji borehole in vicinity of the study area Click here to view Figure |
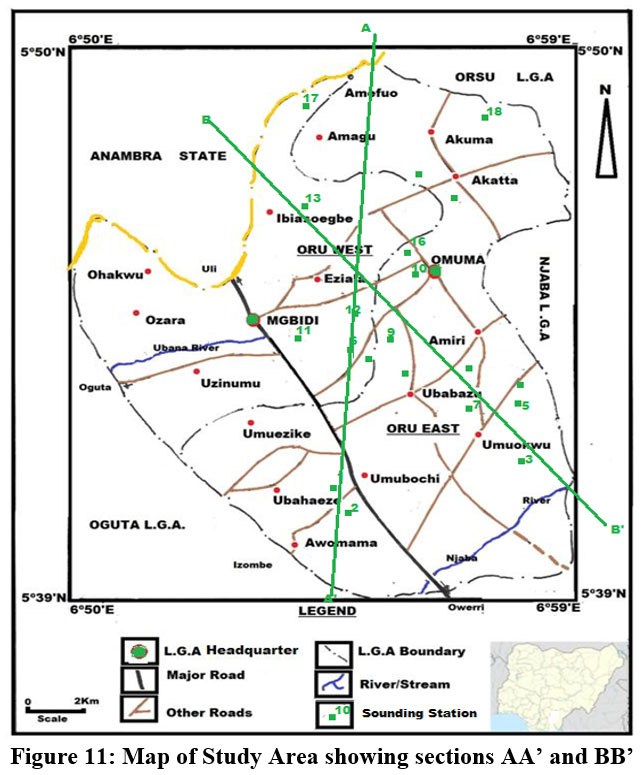 |
Figure 11: Map of Study Area showing sections AA’ and BB’ Click here to view Figure |
Map of Study Area Showing Line of Section AA1 And BB1
Profile AA1 is 13.75km long and is located at the North Southern section of the study area and transversed the following towns Ibiasoegbe, Umuoji, Mgbidi, Otulu Oteru and Ubachima. This profile showed five distinct geo-electric units as shown in figure…12 below. The topsoil is underlain by sandy layer. Uderlying the sandy layer is a sandstone and granite layer which in turn is underlain by a fine medium and coarse grained sands which is the aquiferous layer. At the base is a conductive clay layer. The profile AA1 geooeletric units correlates with the borehole data obtained from the area, the Ura-Akatta borehole and Akwada- Aji borehole2 as in figure10… and figure 9….
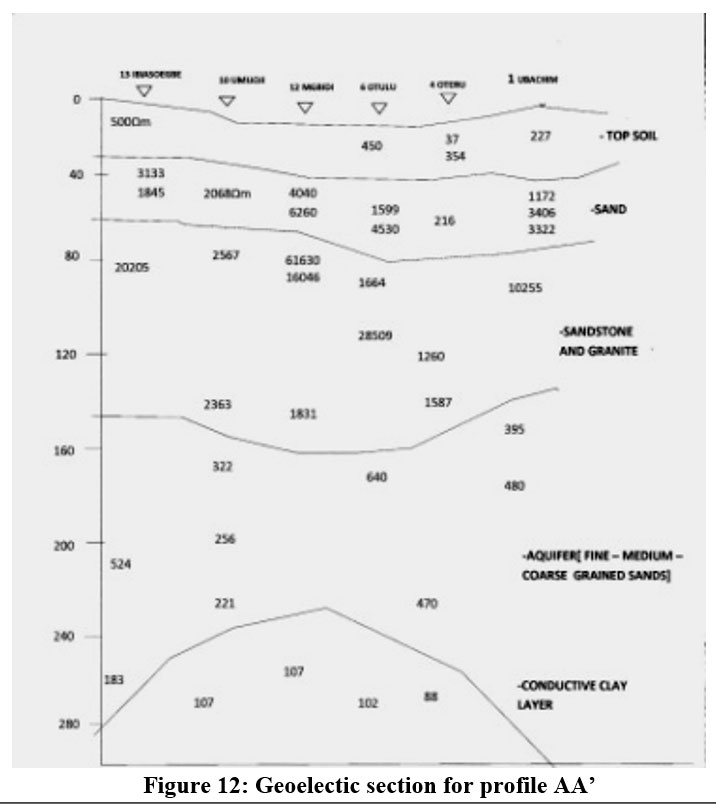 |
Figure 12: Geoelectic section for profile AA’ Click here to view Figure |
Similarly, profile BB1 which measures about 10km long and traverses Ibiasoegbe Ubahazu, Umuowa and Umuokwe areas trends in the (NW-SE) direction. This profile revealed four distinct geoelectric layers as with a conductive clay layer at the base. Over laying the clay base is the saturated sand unit.
Table 1: Aquifer Hydraulic Parameters of the Study Area Using Data from Surface Electrical Soundings1
|
VES NO |
Location |
Apparent Resistivity (ohm) |
Aquifer Depth (m) |
Aquifer Thickness (m) |
Aquifer Conductivity Siemens |
Transverse Resistance (ohm2) |
Longitudinal Conductances(mho) |
|
1 |
Ubachima 1 |
395 |
110 |
119 |
0.0025 |
47005 |
0.30126 |
|
2 |
Ubachima x2 |
317 |
92.4 |
79.3 |
0.00315 |
251381 |
0.250157 |
|
3 |
Umuokwe |
313 |
96.4 |
68.8 |
0.0031948 |
21534.4 |
0.219808 |
|
4 |
Oteru |
470 |
200 |
140 |
0.00213 |
65800 |
0.2979 |
|
5 |
Umuowa |
636 |
86 |
103 |
0.00157 |
65508 |
0.1619 |
|
6 |
Otulu 1 |
640 |
120 |
115 |
0.00156 |
73600 |
0.1796 |
|
7 |
Ubahazu 1 |
642 |
125 |
115 |
0.00156 |
73830 |
0.1791 |
|
8 |
Ubahazu 2 |
645 |
117 |
109 |
0.00155 |
70305 |
0.1689 |
|
9 |
Otulu 2 |
618 |
155 |
122 |
0.00162 |
75396 |
0.1974 |
|
10 |
Umuoji |
221 |
164 |
123 |
0.00452 |
27183 |
0.55656 |
|
11 |
Mgbidi 1 |
196 |
205 |
90 |
0.00510 |
17640 |
0.4592 |
|
12 |
Mgbidi 2 |
1831 |
87 |
67 |
0.000546 |
122677 |
0.03659 |
|
13 |
Ibiaso Egbe |
524 |
84 |
132 |
0.00191 |
69168 |
0.2519 |
|
14 |
Nempi |
3934 |
81.6 |
63.5 |
0.000254 |
249809 |
0.1614 |
|
15 |
Akatta |
3466 |
75 |
74 |
0.000288 |
256484 |
0.02135 |
|
16 |
Aji |
557 |
27 |
24 |
0.00179 |
13368 |
0.043087 |
|
17 |
Ubulu |
2915 |
36 |
69 |
0.000343 |
201135 |
0.023671 |
|
18 |
Akuma |
96.5 |
39 |
41 |
0.01036 |
3956.5 |
0.42487 |
Table 2: Layer parameters from resistivity soundings in the Study area1
Conclusion
In this research work, some aquifer characteristics of parts of Oru LGA have been estimated using electrical resistivity data. The result obtained show that the depth to water table varied from 27m to about 205m. Aquifer thickness varied from 24m to about 140m and the aquiferous zones have resistivity range of between 182Wm to about 3934Wm aquifer conductivity varied from 0-000254Siemens at Nempi to 0.01036Siemens at Akuma,transverse resistance varied from 249809Wm2 at Nempi to 3956.5Wm2 at Akuma longitudinal conductance varied from 0.01614mhos at Nempi to 0.55656mhos at Umuoji.
Acknowledgement
I humbly acknowledge the contributions of the following persons in the production of this work. The officers of Imo State National Population Commission for releasing the 2006 Oru population data. I am also grateful to Imo State Ministry of water resources for the bore hole data within the area. Finally, I thank the typist of this work in person of Victoria Chukwu for a good work done.
References
- Agbodike, I.I.C. (2010). Geoelectric exploration for groundwater in Oru Area of Imo State of South-Eastern Nigeria. An M.Sc project submitted to School of Postgraduate studies Abia State University Uturu. 134p.
- Borehole data from Imo State Ministry of Water Resources.
- Breusse, J.J (1963). Modern geophysical methods for subsurface water exploration, Geophysics, 28
- Chilton, P. J. and Foster, S.S.D. (1995). Hydrogeological characterization and water supply potentials of basement aquifers in tropical Africa, Hydrogeological Journal.
- Desavvagie, T.F and Fayose, E.A. (1970). Excursion A. cretaceous and Tertiary rocks of Southern Nigeria. In: Dessavvagies, T.F and Whiteman, A.J. (eds). African Geol., pp 659 – 66
- Dubba Vijay Kumar et.al. Delineation of groundwater potential zones through electrical resistivity parameters in hard rock terrain, Osmania University campus, Hyderabad, Telangana State India, IOSR journal of applied geology and geophysics, volume 3, issue 6, pp 01-10
- Ekwe. A.C and Opara A.I(2012) Aquifer transmissivity from surface geoelectrical data; a case study of owerri and Environs Southeastern Nigeria. Journal of the geological Society of India
- Igboekwe, M.U. Gurunadha, V.V.S. and Okwueze, E.E. (2005). Groundwater flow modeling of Kwa Ibo River watershed, Southeastern Nigeria. John Wiley and sons Ltd.
- Jupp, D.L.B. and Vozoff, K. (1975). Stable interactive methods for inversion if geophysical data. Geophy. J. RAS 42957-9
- Kogbe, C.A (1976). Geology of Nigeria, Elizabeth Publishing Company Lagos.
- Mbonu, P.D.C, Ebeniro, J.O Ofoegbu, CO and Ekine, A.S (1991) Geoelectric Sounding for the determination of Aquifer characteristics In parts of the Umuahia area of Nigeria
- Niwas and Singhal,D.C.(1981). Estimation of aquifer transmissivity from Dar-Zarrouk parameters in porous media. Journal of Hydrogeology 50,393-399
- Okwueze,E.E (1996). Preliminary findings of the groundwater resources potentials from a regional geoelectric survey of the obudu basement area, Nigeria Gjpas2(2)pp201-211 calabar
- Opara A.I,et.al;(2018) Estimation of hydraulic parameters from surface Geoelectrical data; a case study of Orlu and environs,Imo River Basin,Southeastern Nigeria, Discovery Nature Journal, volume 12.
- Oru Population Data 1991 and 2006. National Population Commission Owerri.
- Pulawaski, B. and Kurth R. (1977). Combined use of resistivity and seismic refraction methods in groundwater prospecting in crystalline areas. Study project Kenya, Danida.
- Reyment, R.A (1965). Aspects of Geology of Nigeria, Ibadan, Nigeria University of Ibadan, 145p
- Short, K.C and Stauble, A.J (1967). Outline of Geology of Niger Delta AAPG Bulletin, Vol. 51.
- Ugada.U et.al(2013a) Delineation of shallow aquifers of Umuahia and environs,Imo- River Basin, Nigeria using Geo-Sounding data; Journal of water Resources and protection,2013,5;1097-1109
- Ugada,U et.al 2013b;Hydrogeophysical evaluation of aquifer hydraulic characteristics using surface geophysical data; a case study of Umuahia and environs, Southeastern Nigeria Arab journal of geosciences,
- Whiteman, A. (1982). Nigeria: Its petroleum geology, resources and potential, Vol 1: Graham and Trotman, 382p.
- Zohdy, AAR (1973).Groundwater exploration with schlumberger sounding near jean, Neveda USGS. Pen file rep no 66
- Zohdy, AAR, Eaton, G.P and Mabey, D.R,(1974). Application of surface geophysics to groundwater investigations U.S Geol Survey

This work is licensed under a Creative Commons Attribution 4.0 International License.