A Petrophysical Properties Evaluation Study of a Niger Delta Field Using Well Logs and Core Data
Adizua, Okechukwu Frank*  and Uzu, Daniel Ugochukwu
1Geophysics Research Group – GRG, Department of Physics, Faculty of Science, University of Port Harcourt, Port Harcourt, Rivers State, Nigeria .
okechukwu.adizua@uniport.edu.ng
http://dx.doi.org/10.13005/OJPS09.01.09
A petrophysical properties evaluation study of an onshore field “NEMA” was carried out to assess the petrophysical characteristics of the field in the eastern portion of the Niger Delta Basin. This was done in an effort to determine the hydrocarbon prospect and oil productivity potential of the reservoirs. The net/gross thickness was one of the examined parameters. (pay zone thickness), porosity, permeability, fluid saturation which were all inferred from geophysical wireline logs and core data. The wireline logs used in the investigation included density, resistivity, gamma ray, and spontaneous potential logs for five different wells from the “NEMA” oil field. Five reservoirs designated, NEMA 01, NEMA 04, NEMA 07, NEMA 09, and NEMA 12 were identified and correlated across the five wells in the field using gamma ray logs and shale resistivity markers. Based on the computation of petrophysical parameters, the porosity of the reservoirs ranged from 0.22 (22%) to 0.31 (31%); the permeability ranged from 851.58 mD to 1005.05 mD; the average net-to-gross thickness of the reservoir sand bodies was 140 ft; the water saturation value was less than 45%, while the hydrocarbon saturation was greater than 55%. We equally observed that our computed petrophysical parameters from well log data correlated well with the core computed values in NEMA 09. In conclusion, the delineated reservoirs were categorized as good hydrocarbon reservoirs. These results suggest huge hydrocarbon potential and a reservoir system whose performance is considered satisfactory for hydrocarbon production.
Copy the following to cite this article:
Adizua, O. F. and Uzu, D. U. A Petrophysical Properties Evaluation Study of a Niger Delta Field Using Well Logs and Core Data. Oriental Jornal of Physical Sciences 2024; 9(1).
DOI:http://dx.doi.org/10.13005/OJPS09.01.09Copy the following to cite this URL:
Adizua, O. F. and Uzu, D. U. A Petrophysical Properties Evaluation Study of a Niger Delta Field Using Well Logs and Core Data. Oriental Jornal of Physical Sciences 2024; 9(1). Available here:https://bit.ly/4az9CJW
Download article (pdf) Citation Manager Publish History


Introduction
The "NEMA" oil field is situated in the eastern portion of Nigeria's onshore Niger Delta Basin, in a coastal region that is covered in swamps. Any oil field's petrophysics, which controls oil recovery and production volume, includes the qualities of the reservoir's rock and fluid. Among other things, these characteristics include fluid saturation, permeability, and porosity. Determining a reservoir system's hydrocarbon potential, performance, and ability to forecast complicated reservoir scenarios all depend on the effective assessment of these attributes. Because they are the primary factors used to determine how much oil and gas were originally present in a location, rock porosity and fluid saturations are significant to reservoir engineers, whereas permeability is a measure of the ease of fluid flow through the pores spaces of the rock (Abdolla and Tegbe, 2010).
Defining and estimating these petrophysical properties is called reservoir characterization. This process integrates the technical disciplines of geology, geophysics, reservoir engineering, production engineering, petrophysics, economics and data management. Key objectives of reservoir characterization focuses on modeling each reservoir unit, predicting well behavior, understanding past reservoir performance and forecasting future reservoir performance (Mohaghegh et al., 2000). The key to success in a reservoir characterization study is to integrate geological, geophysical, petrophysical, engineering, and reservoir performance data to form the most accurate description of the reservoir. Such a study is necessarily an ongoing process, continually refining the working description of the reservoir throughout the producing life of the field. The first step in conducting a characterization study is to identify the geometry, continuity, and internal configuration of the reservoir. This geologic work provides the basic framework for a comprehensive reservoir description. Other information such as well test results, logs, petrophysical data, reservoir pressure history and production data helps to fill in gaps and refine understanding. After the basic geologic framework is in place, the next step is to quantify the reservoir quality of the various geologic facies units. Reservoir quality is determined primarily by the distribution of petrophysical properties such as lithology, porosity and permeability, saturation, formation factor, etc. Geophysical well log data provides accurate reservoir properties by analyzing petrophysical properties taken from a reservoir and thus, is widely used as benchmark or validation data in reservoir characterization (Mohaghegh, 2005). Thus, it is necessary to have knowledge of the composition and characteristics of the reservoir fluids, as well as the rock pore system, in order to fully describe a reservoir and assess its quality.
In order to define lithological units of prospective zones, distinguish between hydrocarbon bearing and non-hydrocarbon bearing zones, define reservoir geometry through well-to-well correlation, and determine the petrophysical parameters value of zones of interest (reservoirs) in the field, such as porosity, permeability, water saturation, and hydrocarbon saturation, the gamma ray (GR), spontaneous potential (SP), resistivity (LLD), and density (PHID) logs were analyzed and interpreted in this study.. The aim of the study was to integrate petrophysical log data with core data to quantitatively characterize reservoirs in NEMA field in a bid to assess the hydrocarbon production potential of the onshore Niger Delta field. This would be achieved through a set of objectives which include delineation of reservoir sand (potential pay zones), estimation of petrophysical properties such as porosity, permeability, fluid saturation which are variables in determining the reservoir quality and comparison of petrophysical logs data with core data. This study would be beneficial as the outputs of the study would guide in field development planning (FDP), aid in the design of fluid injection projects and help evaluate and correct reservoir performance problems.
Geologic Settings of the Study Area
The Niger Delta spans an area of roughly 7500 km² and is located between latitudes 3°N and 6°N and longitudes 4°E and 8°E. It is located in the Gulf of Guinea and has a sizable arcuate delta. The Delta has prograded southwestward from the Eocene to the present, creating deposits that, at each stage of the Delta's formation, represent the most active area of the delta (Doust and Omatsola, 1990). One of the world's biggest regressive deltas is formed by these sediments. Short and Stauble (1967) provided a detailed description of its stratigraphy, identifying three lithostratigraphic units: the Agbada, Akata, and Benin Formations (Figure 1).
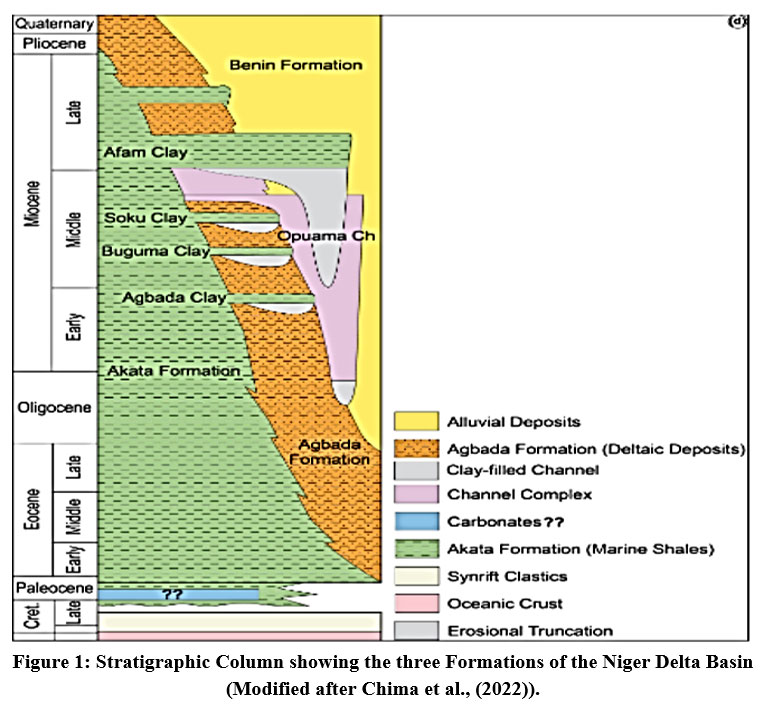 | Figure 1: Stratigraphic Column showing the three Formations of the Niger Delta Basin (Modified after Chima et al., (2022)). Click here view Figure |
During the exploration and production of oil, the stratigraphy of the clastic wedge in the Niger Delta Basin has been documented. The majority of stratigraphic plans are still exclusive to the big oil firms with concessions in the Niger Delta region. The Akata, Agbada, and Benin Formations make up the Niger Delta Basin's composite Tertiary sequence in ascending order. They consist of an estimated 28,000 feet (8,535 meters) of section at the delta's center, at the approximate depocenter (Avbovbo, 2001). Age decreases basinward, which is consistent with the general regression of depositional conditions in the clastic wedge of the Niger Delta Basin. In Eastern Nigeria, there are exposed stratigraphic equivalent units to these three formations. The strata, which were formed in marine, deltaic, and river settings, show a large coarsening-upward progradational clastic wedge (Short and Stauble, 1967). Due to a dearth of drilling data and outcrops, the stratigraphic distribution of these rocks is not well characterized (Avbovbo, 2001). The research area's map is displayed in Figure 2 along with an approximate location of the field's wells on a map of Nigeria.
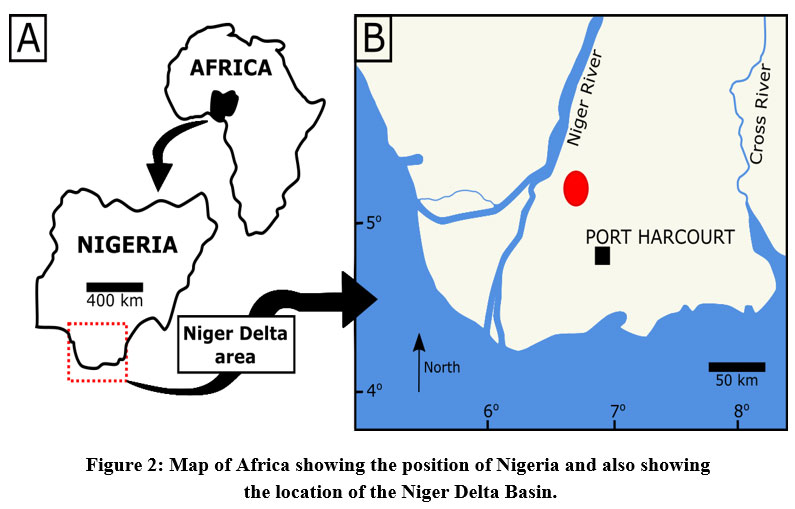 | Figure 2: Map of Africa showing the position of Nigeria and also showing the location of the Niger Delta Basin. Click here to view Figure |
Methodology
A suite of logs from NEMA comprising gamma ray, density, neutron porosity, caliper, sonic and resistivity logs were analyzed from 5 wells (NEMA 01, 04, 07, 09 and 12) within the prospect. Core data were only available for well 09. The log specifications from the different wells are well captured in Table 1.
Table 1: Data Availability
| NEMA – 01 | NEMA- 04 | NEMA – 07 | NEMA -09 | NEMA – 12 |
GR | YES | YES | YES | YES | YES |
NPHI | YES | YES | YES | YES | YES |
RHOB | YES | YES | YES | YES | YES |
CALI | YES | YES | YES | YES | NO |
SONIC | YES | YES | NO | YES | NO |
RESISTIVITY | YES | YES | YES | YES | YES |
CORE DATA | NO | NO | NO | YES | NO |
The workflow (Figure 3) highlights the schematic well log data analysis deployed in the course of the study.
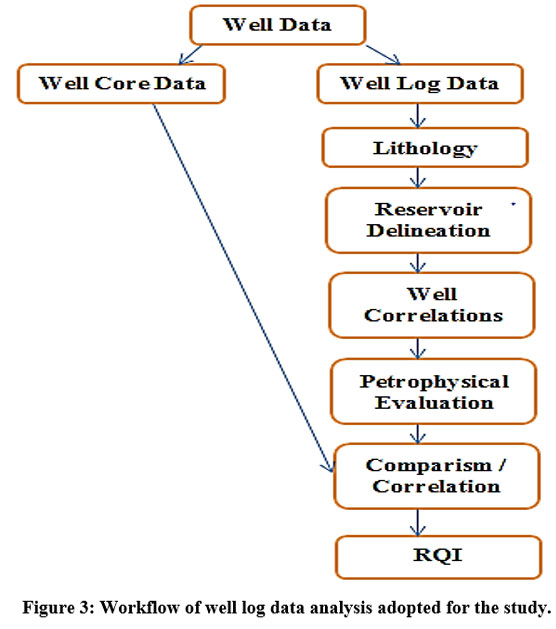 | Figure 3: Workflow of well log data analysis adopted for the study. Click here to view Figure |
The goal of the well log analysis was to ascertain the petrophysical characteristics of defined reservoirs both qualitatively and quantitatively. For lithological information, the spontaneous potential (SP) and gamma ray (GR) logs were analyzed. The sand/shale lithology within the study area was identified by using both logs in conjunction with each other. The gamma ray (GR) log, which measures natural radioactivity in formations, reflects the shale contents in the reservoir formations vis-a-vis at shale beds, while the SP log displays excursion from the shale base line. The resistivity log and the gamma ray (GR) log were utilized to distinguish between zones that were bearing hydrocarbons and those that weren't. The resistivity log signatures in hydrocarbon-bearing formations have higher resistivity values than in water-bearing formations.
By comparing the intervals of logs from various wells for similarities, lithological correlation of analogous strata across the five wells was carried out using the gamma ray log. In parallel, the resistivity and gamma ray logs were used to correlate the prospective hydrocarbon reservoirs in each well, allowing for the determination of their lateral extent as well as the potential presence of faults, dips, and/or unconformities.
Description of Basic Petrophysical Terms
Porosity
This is the fraction of the rock mass occupied by pores or voids. It represents the storage capacity of a rock material. Porosity values can be determined from both core and well log analysis. Both core and log measurements, of course, represent only localized porosity values; logging tools can only measure it at a slight distance from the well bore, and cores are of minuscule size relative to the reservoir. The nature of log and core analysis makes it necessary to scale up measurements to try and reflect actual reservoir characteristics, which raises a whole new set of questions regarding reservoir characterization.
Permeability
Permeability is a property of the porous medium that measures the capacity and ability of the formation to transmit fluids. The rock permeability, K, is a very important rock property because it controls the directional movement and the flow rate of the reservoir fluids in the formation. If hydrocarbons are in the pores of a rock, they must be able to move out of them. Unless hydrocarbons can move from pore to pore, they remain locked in place, unable to flow into a well. The permeability of reservoir rock is strongly dependent on the pore system geometry. In particular, permeability is determined by the size, shape, and interconnection of the pore throats in the rock, that is, the small openings connecting one pore with adjacent pores.
Water Saturation (Sw)
Saturation is defined as that fraction, or percentage of the pore volume occupied by a particular fluid (oil, gas, or water). The fluids in most reservoirs are believed to have reached a state of equilibrium and, therefore, will have become separated according to their density, i.e., oil overlain by gas and underlain by water. In addition to the bottom (or edge) water, there will be connate water distributed throughout the oil and gas zones. The water in these zones will have been reduced to some irreducible minimum. It is generally not uniformly distributed throughout the reservoir but varies with permeability, lithology, and height above the free water table. The porosity logs react to the pore space. The resistivity logs react to the fluids in the pore space. The combination of the two measurements gives saturation. The amount of each fluid is an important parameter. The quantity is usually quoted using the water saturation Sw. This can be computed as the water in the formation described uniquely by its salinity. Hydrocarbons are much more complex and variable. Hence the hydrocarbon saturation is given by (1-Sw) and denoted by Sh.
Lithology Determination
The log used to determine the lithology was the gamma ray log. It ranged from 0 – 150 API. The lithologies penetrated by the wells were shale and sand. Applying quick look log interpretation showed that the signature of gamma ray log deflecting to the left (below the cutoff point; 75 API) formed sand beds. However, shale formations showed prominent high gamma ray signature to the right.
Petrophysical Parameters Evaluation
The evaluated petrophysical parameters in this study were porosity, permeability, water saturation. All these properties were evaluated across the delineated lithologies. Presented below are the relations (models) used in their evaluation.
Porosity Evaluation
Evaluation of porosity was done using the density log. The density matrices of fluid (water) and reservoir rock were read as ?fl = 1g/cm3 and ?mat = 2.65g/cm 3 respectively. Using the formula
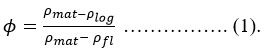
Where ?log is log density value and Ø is formation porosity.
Water Saturation Evaluation
At every depth of formation penetrated by the wells water saturation was delineated using Udegbunam et al. (1988).
Where Sw _ud is water saturation by Udegbunam and Ø is formation porosity.
Permeability Evaluation
Hydrocarbon reservoir quality is highly dependent on permeability. Permeability determines the ease with which fluid can flow through interconnected pore spaces despite other methods of estimating permeability, Owolabi et al. (1994), method was employed. His equation stated that permeability
![]()
Where Ø is formation porosity and Sw _ud is water saturation by Udegbunam.
Presentation of Results and Discussion
This work, which primarily aimed to assess the sand bodies' reservoir quality in an onshore field called "NEMA" in the eastern Niger Delta Basin, was accomplished through the petrophysical analysis of five well logs and core data (for NEM 09) for the field's identified reservoir intervals. Basic data from log analysis was utilized to ascertain the reservoir's petrophysical characteristics, which allowed for the distinction of reservoir from non-reservoir zones, as well as the formation thicknesses of prospective reservoirs, porosity and permeability, and fluid saturation. The basic study of log patterns served as the foundation for the qualitative interpretation. Sandstones made up the majority of the lithology in the reservoirs that were found. The lithological correlation panel for the five wells is displayed in Figure 4, with identified reservoirs at a depth of D1000 interval. in the NEMA field.
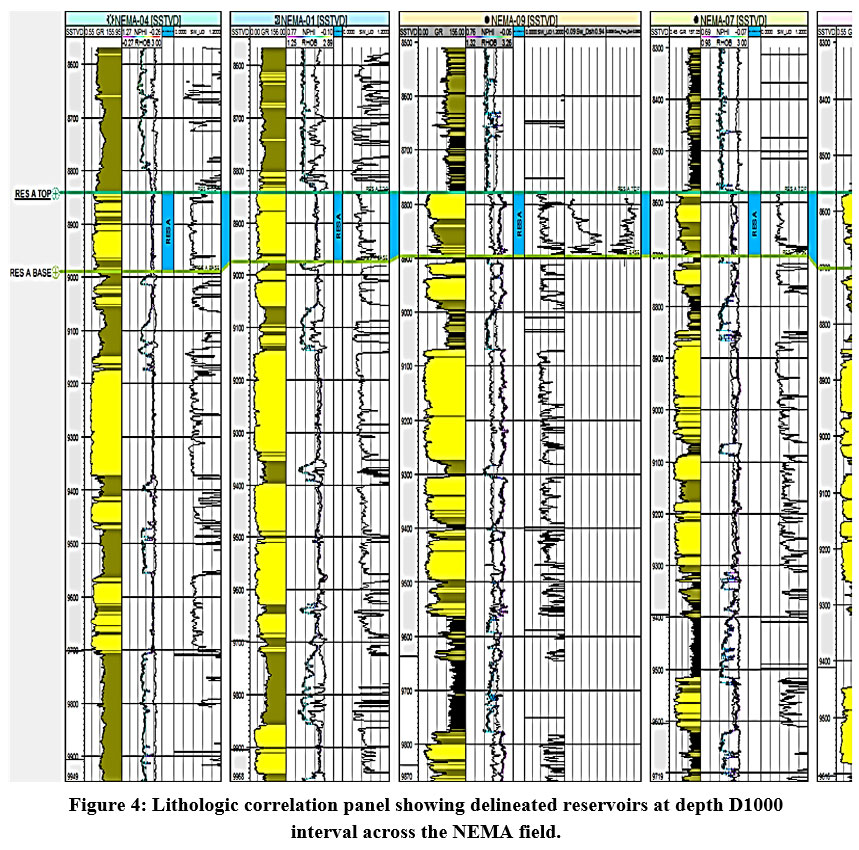 | Figure 4: Lithologic correlation panel showing delineated reservoirs at depth D1000 interval across the NEMA field. Click here to view Figure |
The research reveals that the thickness and depth of each sand unit differs from well to well; this variation may be a sign of faulting. It was found that as one descended in depth, the shale layers rose and the sand layers decreased in proportion. The Niger Delta Basin's pattern suggests a change from the Benin to the Agbada Formation. In an attempt to evaluate the field's hydrocarbon potential, the average of the log analysis results from the five wells was used to assess the quality of the reservoir's petrophysical characteristics and forecast the hydrocarbon possibilities within the designated reservoir sand units. The average petrophysical properties for reservoir D1000 is presented in table 2 while a qualitative interpretation template for porosity as proposed by Rider (1996) is shown in table 3 for a qualitative description of the identified reservoir in terms of porosity. Similarly, table 4 gives Rider’s qualitative interpretation template for permeability.
Table 2: Average Petrophysical Properties of Reservoir D1000
WELL 01 | WELL 04 | WELL 07 | WELL 09 | WELL 12 | |
POROSITY (%) | 20 | 20 | 20 | 16.6 | 20 |
PERMEABILITY (mD) | 851.5 | 1005.5 | 835.91 | 746.47 | 822.95 |
Sw (%) | 73 | 81 | 32 | 43 | 24 |
Sh (%) | 27 | 19 | 68 | 57 | 76 |
THICKNESS (FT) | 138 | 157 | 137.5 | 119.5 | 148 |
Table 3: Qualitative Evaluation of Porosity Template (adapted from Rider (1996)).
Percentage Porosity (%) | Qualitative Description |
0 - 5 | Negligible |
5 – 10 | Poor |
15 – 20 | Good |
20 – 30 | Very Good |
>30 | Excellent |
Table 4: Qualitative Evaluation of Permeability Template (adapted from Rider (1996)).
Average Permeability (K) Value (mD) | Qualitative Description |
<10.5 | Poor To Fair |
15 – 50 | Moderate |
50 – 250 | Good |
250 -1000 | Very Good |
>1000 | Excellent |
From the estimated petrophysical properties, it is evident that the pay zones are appreciable in thickness with thicknesses in feet ranging from 119.5ft in Well 09 to as deep as 157ft in Well 05. Hydrocarbon saturation is appreciably high in Well 09 (57%), Well 07 (68%) and Well 12 (76%). The values of hydrocarbon saturation were low in Well 04 and Well 01. The implication is that these wells are possibly saturated with brine water intrusions from the surrounding coastal swamps. According to Rider [9], the porosities of the reservoir identified are approximately 20% which is good. Similarly, the permeability (K – value) ranged from 746.47mD in Well 09 to as high as 1005.5mD in Well 04. This K – value range is very good according to the Rider’s template. The overall implication therefore, is that the reservoir identified has appreciable thickness, good porosity, high hydrocarbon saturation and very good permeability which make an interesting mix of a good hydrocarbon reservoir system that should be properly harnessed and exploited.
Conclusion
This study was conducted to assess the reservoir quality of sand bodies in the five wells of the "NEMA" field in the onshore Niger Delta by integrating wireline logs and core sample data. According to the results, there is a very good to outstanding range for porosity and a very good to exceptional range for permeability. Pay zones were sufficiently dense to be economically viable for complete exploitation. The porosity gradually decreased as depth increased. The permeability values also follow a similar pattern, demonstrating a little reduction with depth. This is most likely due to compaction and diagenesis related to the older sediments' depth of burial during deposition. In general, the field's hydrocarbon saturation was higher than 55%, but the water saturation value was less than 45%. According to the value of the bulk volume of water, the reservoirs are at the irreducible water saturation stage, which suggests that they have the capacity to generate hydrocarbons without water and would further the field's exploitation goals.
Acknowledgements
The authors would like to acknowledge the Department of Petroleum Resources (DPR) and the Nigeria Agip Oil Company (NAOC) for provision of the academic research dataset used for prosecuting the study. We held meaningful discussions with Mr. Chijioke Zion Okabie who was with Laser Petroleum Geoscience Center, Port Harcourt at the time this study was carried out but is now with Pioneer-Alfa Petroleum Services. The University of Port Harcourt, Nigeria is appreciated for providing the teaching and research platforms.
Funding Sources
The authors received no financial support for the research, authorship and/or publication of this article.
Conflict of Interest
The authors declare no conflict of interest.
References
- Abdolla T. and Tegbe O.O. (2010). Reservoir heterogeneities as a controlling factor to the abnormal production performance of the oil field “Y” NE, Niger Delta. NAPE bulletin, 15(1), 81-91.
- Mohaghegh S., Reeves S., and Hill D. (2000). Development of an intelligent systems approach for reservoir candidate selection. The Proceeding of 2000 SPE/CERI Gas Technology Symposium, Calgary, Canada, SPE 59767.
- Mohaghegh S. (2005). Recent developments in application of artificial intelligence in petroleum engineering. Journal of Petroleum Technology. 57(4), 86-91.
CrossRef - Doust H. and Omatsola E. (1990). Niger Delta, in, Edwards, J. D., and Santogrossi, P.A., eds.,Divergent/passive Margin Basins. American Association of Petroleum Geologists - AAPG Memoir 48. 48(1), 239-248.
- Short K.C. and Stauble A.J. (1967). Outline of Geology of Niger Delta. American Association of Petroleum Geology - AAPG Bulletin. 51(5), 761–779.
CrossRef - Avbovbo A.A. (2001). Tertiary lithostratigraphy of Niger Delta. American Association of Petroleum Geologists – AAPG Bulletin. 62(1), 295-300.
- Udegbunam E.O. and Ndukwe K. (1988). Rock property correlation for hydrocarbon producing sand of the Niger Delta Sand. Oil and Gas Journal.
- Owolabi O. O., Longjohn T. F. and Ajienka J. A. (1994). An empirical expression for permeability in unconsolidated sands of eastern Niger Delta. Journal of Petroleum Geology. 17(1), 111-116.
CrossRef - Rider M. H. (1996). The Geological Interpretation of Well Logs. 2nd ed. Whittles Publishing: Caithness, 1996.
- Chima K. I., Granjeon D., Couto D. D., Leroux E., Gorini C., Rabineau M., Letouzey J., Hoggmascall N. and Glukstad M. (2022). Tectono-Stratigraphic evolution of the offshore western Niger Delta from the cretaceous to present: implications of delta dynamics and paleo-topography on gravity-driven deformation. Basin Research, 34, 25-49.
CrossRef

This work is licensed under a Creative Commons Attribution 4.0 International License.