
Formulation and Optimization of Immediate Release Cajanus Cajan Starch-Based Tablets Containing Metronidazole
Ahmed Abdalla Bakheit Abdelgader1*  , Daud Baraka Abdallah1 , Elnazeer I. Hamedelniel2 , Hiba Atif Mutwakil Gafar3 and Mohammed Abdelrahman Mohammed3
1Department of Pharmaceutics, Faculty of Pharmacy, The National Ribat University, Khartoum, Sudan .
2Department of Pharmaceutics, Faculty of Pharmacy, Omdurman Islamic University, Khartoum, Sudan .
3Department of Pharmaceutics, Faculty of Pharmacy, University of Gezira, Wad Medani, Sudan .
http://dx.doi.org/10.13005/OJPS05.01-02.05
Copy the following to cite this article:
Abdelgader A. A. B, Abdallah D. B, Hamedelniel E. I, Gafar H. A. M, Mohammed M. A. Formulation and Optimization of Immediate Release Cajanus Cajan Starch-Based Tablets Containing Metronidazole. Oriental Jornal of Physical Sciences 2020; 5(1,2). DOI:http://dx.doi.org/10.13005/OJPS05.01-02.05
Copy the following to cite this URL:
Abdelgader A. A. B, Abdallah D. B, Hamedelniel E. I, Gafar H. A. M, Mohammed M. A. Formulation and Optimization of Immediate Release Cajanus Cajan Starch-Based Tablets Containing Metronidazole. Oriental Jornal of Physical Sciences 2020; 5(1,2). Available From: https://bit.ly/3ygIQCj
Download article (pdf) Citation Manager Publish History



Introduction
Pharmaceutical excipients refer to all materials other than the active drug added intentionally to the formulation of a dosage form 1. They are essential components in pharmaceutical formulation, to assist with many essential aspects during the pharmaceutical product development process such as processability during the manufacturing, increase stability, and granting the finished products with distinct or particular taste and colour 2. Excipients are obtained from different origins: animals such as gelatin and stearic acid, plants such as starches and cellulose, minerals such as calcium phosphate, and synthetics like polyethylene glycols (PEGs) and povidone 3. Presently, there is a need for safe and natural excipients with various uses due to the concerns raised with the use of synthetic polymers and animal-based products 4.
Starch is a natural carbohydrate reserve found in almost all parts of plants; it is widely abundant and considered one of the most commonly used pharmaceutical additives, mainly in tablet dosage forms. Starch paste has been employed as a tablet binder in a concentration ranging from 3% to 20% w/w and incorporated into it via the granulation technique 5. Also, starch is used as a disintegrant agent at concentrations ranging from 3 to 25% w/w 5.
At present, commercial starch is traced from a constrained range of crops, comprising maize, wheat, tapioca, & potatoes 6-7. The physicochemical properties and pharmaceutical benefits of starch and its use vary according to its biological origin and source, and that arises from its different amylose/amylopectin ratio; due to that, a quest for new sources of starch with different physicochemical and functional properties is a rich area of scientific research 8-9.
Sparing investigation and study have been performed on starch from Cajanus cajan regarding its extraction, physicochemical characterization, and pharmaceutical use. Also, few researchers had declared that Cajanus cajan contains high carbohydrate sources, making it a prospective origin for starch 5.
Metronidazole is a nitroimidazole compound 10, used widely as an antibiotic against anaerobes 11, and for treatment of infection caused by protozoa 12. The MNA powder possesses poor compression characteristics 13-14. MNA is formulated and used in different strengths and dosage forms such as tablets, syrups, creams, and gels 12. After the oral administration, the MNA absorbed wholly and rapidly 10,12. Various binders and disintegrants sourced from natural origins such as starch, gum, and mucilage from cashew, Colocassia esculenta, Albelmoschus esculentus, Cochorus olitorious, Aloe barbadensis, Spondias purpurea, Brachystegia eurycoma, Irvingia gabonensis, Cyperus esculentus L., Triticum aestivum, cassava, and Zingiber officinale in addition to sodium starch glycolate, gelatin, microcrystalline starch methylcellulose and maize starch BP have been evaluated and used in metronidazole tablet formulation 12-13,15-25.
Most scientific experiments measure the effect of one or more factors (independent variables) on the experiment's outcome (response or dependent variable). One tool to measure this effect is the experimental design or design of experiments (DoE) 26. Statistical DoE allows all potential factors to be evaluated simultaneously and systematically. Experimental design is an instrument used in evaluating the effects of formulation factors on different primary responses and possible interaction effects; thus, critical parameters are analyzed based on statistical analysis. Final formulation parameters are then defined using optimization, where the levels of all critical factors are determined 27. Employing Response Surface Methodology (RSM), impacts of selected variables on responses in defined experimental region are predicted via mathematical models. The goodness of fit of those mathematical models is then checked statistically. Therefore, RSM is a collection of mathematical & statistical methods used for model analysis. The number of experiments needed to establish a mathematical trend in design space can be minimized by using RSM, letting specification of most suitable levels of experimental variables needed for a given response 27-28.
Central composite design (CCD) is second-order design most frequently employed to study & optimize tablet formulations. Using CCD, response surfaces that permit the rating of each factor depending on its significance on the responses studied are possibly created. Using these tools, predicting the formulation composition will produce the desired response in a shorter time and less experimental effort 29. The central composite design is composed of factorial experiment, axial points & center points. In recent years, these designs are extensively used to optimize various drug delivery technologies such as sustained-release tablets, liposomes, microspheres and nanoparticles 28.
This study aims to investigate and optimize the effect of non-conventional used Cajanus cajan starch (CCS) concentrations & wet massing granulation time on physicochemical properties of metronidazole (MNA) tablets.
Materials and Methods
Materials
Cajanus cajan seeds were used to extract CCS in our pharmaceutics laboratory, The National Ribat University (Khartoum, Sudan). Sodium starch glycolate (SSG), metronidazole (MNA) & metronidazole working standard powders were gifted by Blue Nile Pharmaceutical Company. Potassium Bromide from Azal Pharmaceutical Company (Khartoum, Sudan). Magnesium stearate (Mg. St.) and Poly Vinyl Pyrrolidone (PVP) were purchased from (Techno pharmchem, India). Xylene (LOBAChemie, India) was purchased from local market. All other chemicals and solvents were of an analytical or higher grade.
Methods
Drug-Starch Compatibility Study
The method described by Khalid et al.14 was used to perform the compatibility studies using FTIR (IR Affinity-1, Shimadzu, Japan).
Tablets Preparation
MNA tablets of 200 mg each were prepared using the wet granulation technique. Table (1) shows the amount and role of different ingredients employed in preparing MNA tablets formulations. Prior to use, MNA was sieved through BSS # 25 (Filterwel Test Sieves, Mumbai, India), and all the excipients were screened through BSS # 85 mesh sieve. The required quantities of MNA, PVP and half quantity of CCS (2) were blended for 10 min in polyethylene pouch. The slurry was prepared in stainless steel pot by mixing equal weights of CCS (1) and cold water. Hot water heated at 85 ?C for 30 min was added to slurry until the quantity of water added amounted to 25% w/w of the total formula weight, continuously stirred until a smooth paste was obtained. The paste was cooled and then added to the prepared MNA, PVP, and CCS (2) mixture. An amount of water equal to that lost during evaporation was used to rinse the pot and added to mixture. The granulation process was carried out in a planetary mixer at 34 rpm for determined time with a pause at one and two thirds of the time to abrade the blades and sides using a spatula. The obtained wet mass was then screened through BSS# 12 sieve and dried to loss on drying (LOD) between 2.9 and 4.5% w/w. After that, the resizing of dried granules was performed through the BSS # 18 sieve. The remaining half of the starch, i.e. CCS (2), was used to serve as extra granular disintegrant. So it was mixed with the dried granules for 3 min, then the mixture was lubricated with 0.5 % w/w Mg. St. for 2 min before being compressed into round flat-surfaced tablets using a single punch tabletting machine (Erweka Type EP-1, Heusenstamm, Germany) with 9 mm tooling. The compressional force was 4-8 KP. To minimize interference between CCS (2) and CCS (1), CCS (2) was added as a dry powder to all formulae and at the same quantity, while CCS (1) was added as a paste.
Table 1: Basic Formula for Tablets Formulated with CCS.
|
Substance |
Amount (1 tablet) |
Role |
|
MNA |
0.2 g |
Active substance |
|
CCS (1) |
*** |
Binding agent |
|
PVP |
6% |
Binding agent |
|
CCS (2) |
6% |
Disintegrant |
|
Mg. St. |
0.5% |
Lubricant |
|
Water |
25% |
Granulating liquid |
*** % of CCS as varied as per experimental design
Experimental Design
A central composite design with α = 1.41421 was used to investigate and optimize the significance of two independent factors (A = % CCS paste and B = wet massing time (WMT)) on the dependent variables disintegration time (Y1), % friability (Y2), and hardness (Y3). Each independent variable was varied over 5 levels, i.e. (-α, -1, 0, +1, and +α). The center point was studied in quintuplicate. All other formulations and process variables were kept constant.
Thirteen formulations (F1 to F13) were prepared as per the experimental design, as seen in Table (2). A second-order model was established for the responses, and a polynomial equation (1) was generated. The validity of the mathematical model was checked through analysis of variance (ANOVA).
Y=b0+b1A+b2B+ b12AB+ b11A2+b22B2 (1)
A, B represent the main effects, A2 and B2 the quadratic effects, and AB is the interaction effect. Y represents responses (disintegration time, friability, and hardness of tablet); b0 is an intercept representing the arithmetic average of all quantitative outcomes of 13 runs, and b1, b2, b12, b11, b22 represent the regression coefficients.
Table 2: Factor Combinations as per the Chosen Experimental Design (CCD)
|
Formulation code |
Coded factor levels |
|||||
|
|
A |
B |
||||
|
F1 |
-1 |
-1 |
||||
|
F2 |
+1 |
-1 |
||||
|
F3 |
-1 |
+1 |
||||
|
F4 |
+1 |
+1 |
||||
|
F5 |
-1.41 |
0 |
||||
|
F6 |
+1.41 |
0 |
||||
|
F7 |
0 |
-1.41 |
||||
|
F8 |
0 |
+1.41 |
||||
|
F9 |
0 |
0 |
||||
|
F10 |
0 |
0 |
||||
|
F11 |
0 |
0 |
||||
|
F12 |
0 |
0 |
||||
|
F13 |
0 |
0 |
||||
|
Actual values for the coded levels |
||||||
|
|
+1.41 |
+1 |
0 |
-1 |
-1.41 |
|
|
A: % CCS paste |
13.66 |
12 |
8 |
4 |
2.34 |
|
|
B: WMT (Min) |
13.24 |
12 |
9 |
6 |
4.76 |
|
Preparation of Tablets for Comparative Purposes
Extra batches of metronidazole tablets were formulated using the optimized formula according to Table (3). The tablets prepared using the same process as provided above except for formulations F14 and F15, in which the specified amount of granulating water was added to the powder mix composed of MNA, PVP and half the amount of disintegrant, i.e. no starch paste was used.
Table 3: Formulations used for Comparative Purposes.
|
Role |
Ingredient |
Amount (1 tablet) % w/w |
|||
|
|
|
F14 |
F15 |
F16 |
F17 |
|
Active |
MNA |
0.2 g |
0.2 g |
0.2 g |
0.2 g |
|
Binding agent |
CCS |
__ |
__ |
12 % |
__ |
|
Binding agent |
Maize starch |
__ |
__ |
__ |
12 % |
|
Binding agent |
PVP |
6% |
6% |
6% |
6% |
|
Disintegrant |
CCS |
6 % |
__ |
__ |
6 % |
|
Disintegrant |
SSG |
__ |
6 % |
6 % |
__ |
|
Lubricant |
Mg. St. |
0.5% |
0.5% |
0.5% |
0.5% |
|
Granulating liquid |
Water |
25% |
25% |
25% |
25% |
Evaluation of Tablet Characteristics
Stress relaxation for 24 hours was allowed for all compressed tablets before subjecting to quality control tests. The weight uniformity, friability percentage, crushing strength, and disintegration time were evaluated and determined following the method of Shailendra 30. Also, the calibration curve for metronidazole was carried out, and the drug release profile was evaluated based on the method of Okpanachi et al. 31.
Statistical Analysis
The Design Expert®8 was used to study the effect of CCS paste amount and WMT on prepared tablets’ characteristics and optimize them. Also, the results obtained were expressed as a mean ± standard deviation calculated using Microsoft excel 2010 software. SPSS version 16.0 for windows (SPSS Inc. Sep 2007) was used for statistical analysis. Analysis of variance (ANOVA) followed by the Tukey HSD multiple comparisons, Kruskal-Wallis H followed by Mann-Whitney U test and t-test were used to compare the results at 95% confidence interval (p < 0.05).
Results and Discussion
Drug-Starch Compatibility Study
The studies of FTIR spectra of metronidazole, CCS and physical mixture of MNA-CCS Figures (1) showed no chemical interference between CCS and MNA.
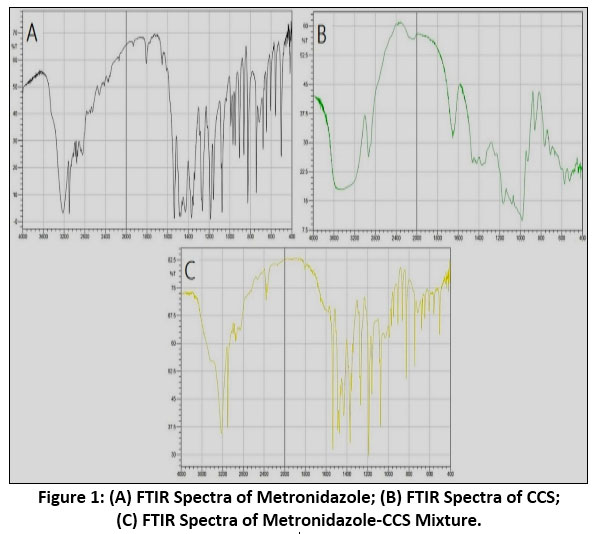 |
Figure 1: (A) FTIR Spectra of Metronidazole; (B) FTIR Spectra of CCS; (C) FTIR Spectra of Metronidazole-CCS Mixture. Click here to view Figure |
Characterization of Tablets
Weight Uniformity
The percentage coefficients of weight variation (% CV) were calculated for formulations prepared with CCS (F1 to F13) and for formulations prepared for comparative purposes (Fopt to F17) and shown in Figure (2A) and Figure (2B), respectively. As evident from the results, all of the tablets batches passed the weight uniformity test, with the standard deviation being within the specifications.
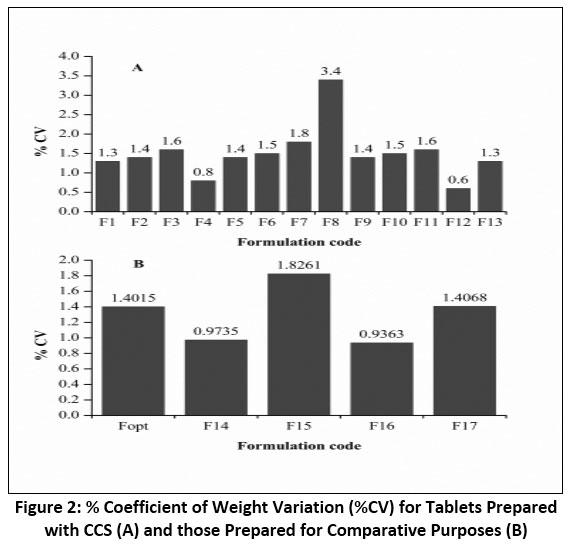 |
Figure 2: % Coefficient of Weight Variation (%CV) for Tablets Prepared with CCS (A) and those Prepared for Comparative Purposes (B) Click here to view Figure |
Crushing Strength
The effects of % CCS paste and WMT on the hardness of tablets of formulations (F1 to F13) are depicted in Figure (3). MNA tablets for all formulations showed a good hardness profile and conformed to specifications for tablet hardness of between 5 to 8 kg. The tablet hardness values ranged from 5.21 ± 0.455 (F1) to 8 ± 0.913 (F6). The tablet hardness of the formulations F5, F1 and F3 were 5.41, 5.21 and 5.84, respectively. Similarly, the tablet hardness of the formulation F6, F2 and F4 were 8, 7.18 and 6.41, respectively. The results indicated that the hardness of tablets increased as the concentration of CCS paste increased. Also, from the results, the WMT exhibited no significant effect on the crushing strength of MNA tablets.
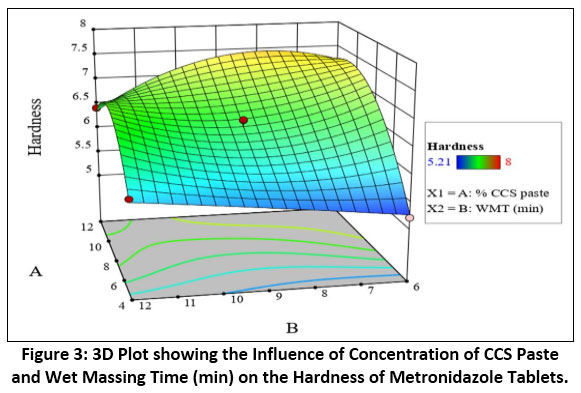 |
Figure 3: 3D Plot showing the Influence of Concentration of CCS Paste and Wet Massing Time (min) on the Hardness of Metronidazole Tablets. Click here to view Figure |
Friability
Generally, friability values of ≤ 1% are acceptable for tablets formulated by the wet granulation method. However, for tablets prepared by direct compression, friability values up to 2% are acceptable 32. The results of % friability for MNA tablets of formulations (F1 to F13) ranged from 0.75 ± 0.036 to 1.04 ± 0.03. The tablets of F5 and F3 exhibited 1.04 ± 0.03 and 1.01 ± 0.01 % friability values, respectively. Similarly, the % friability values of F2 and F6 were 0.75 ± 0.036 and 0.85 ± 0.006, respectively. From these results, the % friability decreased as the concentration of the CCS paste in the formulation increased. At the 4% CCS paste, the % friability increased from 0.84 ± 0.03 (F1) to 1.01 ± 0.01 (F3) as the WMT increased from 6 min to 12 min, respectively. Also, when the concentration of CCS paste was 12%, increasing WMT from 6 min to 12 min led to a rise of the % friability from 0.75 ± 0.036 (F2) to 0.92 ± 0.036 (F4) respectively. These results indicate that the % friability value increases with the increase in WMT and decreases with the increased levels of CCS paste. These results can be visualized in Figure (4), demonstrating the effects of concentration of CCS paste and WMT on the % friability of prepared tablets.
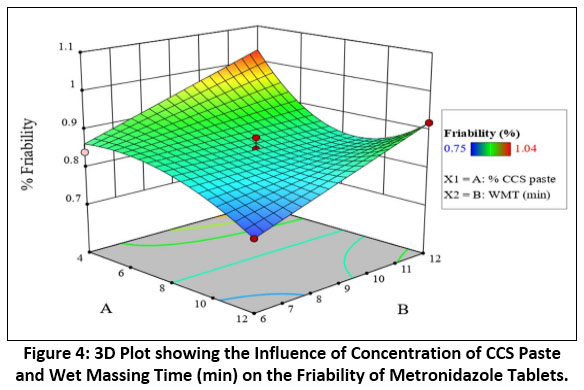 |
Figure 4: 3D Plot showing the Influence of Concentration of CCS Paste and Wet Massing Time (min) on the Friability of Metronidazole Tablets. Click here to view Figure |
Disintegration Time (DT)
Figure (5) demonstrates the effects of concentration of CCS paste and WMT on the disintegration behaviour of MNA tablets of formulations (F1 to F13). At 6min WMT, increase of CCS paste concentration from 4% (F1) to 12% (F2) led to decrease in DT from 12.6 ± 0.443 to 5.28 ± 0.19 min respectively. Also at 9 min WMT, the disintegration time lowered from 18.42 ± 1.25 (F5) to 14.57 ± 1.18 (F9) and to 6.75 ± 1.64 (F6), due to increase of CCS paste concentration from 2.34% (F5) to 8% (F9) and to 13.66% (F6) respectively. Similarly, at 12 min WMT, the rise of concentration of CCS paste from 4% (F3) to 12% (F4) led to a decrease in DT from 17.95 ± 0.476 to 7.75 ± 0.797 min respectively. Generally, from these results, it is obvious that the increase in CCS paste concentration led to a decrease in DT; this may be due to swelling of the portion of CCS that escaped hydrolysis during starch paste preparation, which then behaves as a disintegrant. At 4% CCS paste concentration decrease in WMT from 12 min to 6 min resulted in lowering DT from 17.95 ± 0.476 min (F3) to 12.6 ± 0.443 min (F1). This decrease in DT may be due to insufficient WMT necessary for homogeneous distribution of this low concentration of CCS paste throughout the granules, leading to low hardness and easily breakable tablets. At high CCS paste concentration, 12%, increasing in WMT from 6min to 12min resulted in slight raise in DT from 5.28 ± 0.19 (F2) to 7.75 ± 0.797 (F4) respectively. Contrarily, at a medium concentration of CCS paste, 8%, increase in WMT from 4.8 min to 13.24 min, slightly lowered the DT from 11.53 ± 2.72 (F7) to 9.3 ± 2.61 (F8). These results indicate that the effects of the WMT on DT rely on the variation of CCS paste concentration.
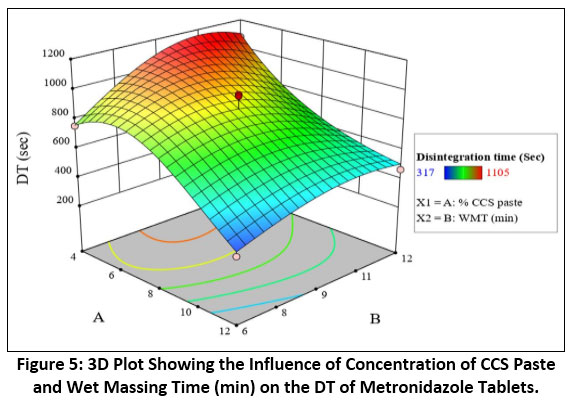 |
Figure 5: 3D Plot Showing the Influence of Concentration of CCS Paste and Wet Massing Time (min) on the DT of Metronidazole Tablets. Click here to view Figure |
Experimental Design (DoE)
A central composite design (CCD) is a valuable tool in response surface methodology (RSM) to build a second-order (quadratic) model for the response variables. The design consists of three sets of experimental runs, i.e. factorial design, a set of center points, and axial points 27. Disintegration time (Y1), friability (Y2) and hardness (Y3) were chosen as dependent variables to be optimized.
The responses were analyzed using Design-Expert®8 software. The best-fitting model was selected based on a comparison of several statistical parameters, including the coefficient of variation (C.V.), multiple correlation coefficient (R2), Prediction error sum of squares (PRESS), predicted R2, adjusted multiple correlation coefficient (adjusted R2), predicted R2 and adequate precision. The analysis of the three responses showed that the modified quadratic model was the most suitable one (p < 0.05). The statistical analysis proved that A, A2, B2 and A2B are significant model terms for DT (Y1), A, A2B are significant model terms for the friability (Y2) and A, B2, A2B2 are significant model terms for the hardness (Y3). 3D graphs of the three responses are demonstrated in Figures (3, 4, and 5). By running ANOVA, the final equations of the responses in terms of coded factors were obtained, equations (2-4) for the responses Y1-Y3, respectively.
Ln Y1 (DT) = 6.77–0.39 A–0.076 B–0.15 A2–0.19 B2 +0.26 A2B (2)
Y2 (Friability) = 0.85–0.056 A+0.043 A2+0.085 A2 B (3)
Y3 (Hardness) = 6.45+0.92 A–0.091 B–0.35 AB+0.46 B2– 0.28 AB2– 0.76 A2B2 (4)
Where A and B representing the coded levels of the independent variables and the terms AB and A2/or B2 represent the interaction and quadratic terms, respectively.
The polynomial equations were used to draw conclusions considering the magnitude of the coefficient and its mathematical sign. From equation (2), both the main effect terms A (% CCS paste) and the quadratic terms A2 and B2 have a dominant-negative effect on the Ln value of DT. In contrast, the interaction term A2B has a significant positive effect on the Ln DT. From equation (3) and as stated before, the A and A2B are significant model terms for response Y2 (friability). It seems that friability has a negative relationship with the % CCS paste as the main effect and a positive relationship with the term A2B as an interaction term. Also, as observed from equation (4), the A, B2, A2B2 are significant model terms for the hardness (Y3). It is concluded that hardness has a positive relationship with both A and B2 as main and quadratic effects. In comparison, the A2B2 has a negative quadratic interaction effect on this response.
Optimization
The three responses, hardness, friability, and DT, were chosen for both graphical and numerical optimization in this design. In order to obtain an optimized formulation, DT and friability were set to be minimized, while the crushing strength was set to be maximized. As in (Figure 6), the contour plots are used to visually search for the best compromise, which stands for the formulation with desirable values for all responses, simultaneously. Also, the defined desirable areas of all responses were overlapped to generate the region of interest.
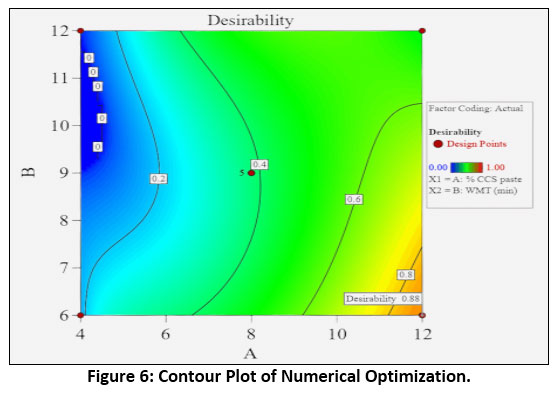 |
Figure 6: Contour Plot of Numerical Optimization. Click here to view Figure |
Using the optimization module from design expert®8 software and the superior value for the responses, and based on the desirability approach for optimization, the solution indicated that the % CCS paste at level +1 (12%) and WMT at level -1 (6 min), yielding 346.5 second DT, 0.75 % friability and 7.23 kg/ cm2 hardness with the desirability of 0.887. Table (4) presents the numerical optimization, and Table (5) shows the selected numerical optimization solution.
Table 4: Solution of numerical optimization.
|
Constraint name |
Goal |
Lower limit |
Upper limit |
Weight |
Importance |
|
% CCS paste |
Is in range |
-1 (4%) |
+1 (12%) |
1 |
3 |
|
WMT |
Is in range |
-1 (6 min) |
+1 (12 min) |
1 |
3 |
|
DT |
Minimize |
317 sec |
1105 sec |
1 |
3 |
|
Friability |
Minimize |
0.75 % |
1.04 % |
1 |
3 |
|
Hardness |
Maximize |
5.21 kg/cm2 |
8 kg/cm2 |
1 |
3 |
Table 5: Selected solution of numerical optimization.
|
No. |
% CCS paste |
WMT |
DT (sec) |
Friability |
Hardness |
Desirability |
|
1 |
12 % |
6 min |
346.5 |
0.75 % |
7.23 kg/cm2 |
0.887 |
The practical results obtained from the optimum formula and those predicted by the experimental design were close. Then the optimized formula was selected and used later on for comparative purposes.
Comparative Study of Optimized Formula (Fopt)
Disintegration
Fopt with F14, F16 and F17
The results of the DT are shown in Figure (7). The disintegration time of Fopt, F14, F16 and F17 was 5.28, 18.69, 4.99 and 13.52 min, respectively. On comparing DT of Fopt with F14, F16 and F17, there was a significant difference (p < 0.05) between Fopt and F14 and F17, while there is no significant difference (p > 0.05) between the DT of Fopt and F16. Generally, all the formulations passed the DT test, except for the tablets of F14, which formulated without incorporation of 12% starch paste; all other formulae disintegrated in less than 15 min. The formulations disintegrated fast in the order: F16 >Fopt> F17 > F14. The presence of 12% starch paste in Fopt, F16 and F17 led to an increased total amount of starch and decreased DT as a consequence of the starch concentration. Also, the tablets formulated with 12% CCS paste (Fopt and F16) disintegrated significantly (P<0.05) faster than the tablets formulated with the 12 % maize starch paste. Schwartz and Zelinskie (1978) suggested that the amylose was responsible for the disintegrating property 33. An excipient's hydration and swelling capacity determine the water penetration and absorption, which precedes the tablet disintegration 34. The amylose content of CCS and maize starch was 32.9 and 24.2. In addition, their hydration capacity was 1.99 and 1.84, and their swelling capacity was 1.46 and 1.23, respectively. The higher amylose content, hydration capacity and swelling capacity of CCS impart them good disintegration properties compared to maize starch.
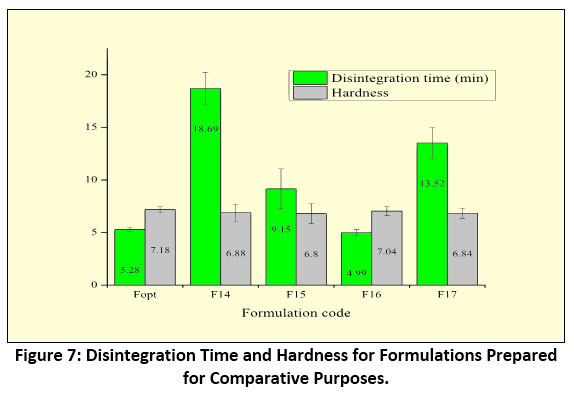 |
Figure 7: Disintegration Time and Hardness for Formulations Prepared for Comparative Purposes. Click here to view Figure |
F15 with F14 and F16
The disintegration time of F14, F15 and F16 was 14.69, 9.15 and 4.99 min, respectively (Figure 7). There is a significant difference between the DT of F15 and F14 and F16 (p < 0.05). The ranking order of DT was F16 < F15 < F14. F16 tablet, which contained 12% CCS paste as binder and 6% sodium starch glycolate as a disintegrant, exhibited faster DT than F15 (formulated with 6% sodium starch glycolate) and F14 (formulated with 6% CCS) as disintegrants. F14 tablets, which formulated with 6% CCS, exhibited higher disintegration time than those of F15, which formulated with 6% sodium starch glycolate as a disintegrant, and this indicates that the CCS at 6% concentration is ineffective as a disintegrant and has less disintegrating activity as compared with the sodium starch glycolate.
Friability
Figure (8) shows the % friability of tablets for formulation Fopt, F14, F15, F16 and F17. The results of % friability for Fopt, F14, F15, F16 and F17 were 0.75, 0.93, 0.92, 1.23 and 0.76, respectively. All the formulations exhibited % friability less than 1% and passed the friability test, except the F16. The ranking of % friability was Fopt< F17 < F15 < F14 < F16. There is a significant difference (p < 0.05) between Fopt and F14, F15 and F16, while there is no significant difference (p > 0.05) between Fopt and F17. F14 and F15, which were formulated without 12% starch paste, showed a higher percentage of friability. In comparison, the friability decreased obviously in formulae Fopt and F17, which were formulated with 12% CCS paste and 12% maize starch paste, respectively. Due to reducing the bonding forces between particles, the super disintegrant sodium starch glycolate negatively affected the friability 34. F16, which was formulated with 12% CCS paste and 6% sodium starch glycolate, exhibited higher percentage friability; this could be due to sodium starch glycolate and the interaction effect between sodium starch glycolate and CCS paste.
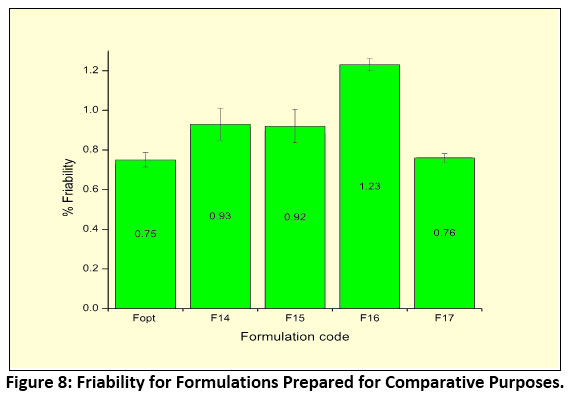 |
Figure 8: Friability for Formulations Prepared for Comparative Purposes. Click here to view Figure |
Hardness
The results of hardness are depicted in Figure (7). The hardness of Fopt, F14, F15, F16 and F17 was 7.18, 6.88, 6.8, 7.04 and 6.84, respectively. There is no significant difference (p > 0.05) between Fopt, F14, F15, F16 and F17. The formulations are harder in the order, Fopt> F16 > F14 > F17 > F15. Tablets of Fopt and F16, which were formulated with 12% CCS paste, showed a slight increase in hardness compared to tablets of F17, which formulated with 12% maize starch paste and to tablets of F14 and F15. These results may indicate that the CCS paste has a positive effect on the crushing strength of tablets and as effective as maize starch paste. Both Fopt and F16 formulated with 12% CCS paste, but F16 tablets exhibited hardness values slightly less than that of Fopt tablets; this could be due to sodium starch glycolate (6 %) in the F16 tablets.
Dissolution Test
Dissolution testing is an indirect method for measuring drug availability, especially when assessing formulation factors and manufacturing methods that may affect bioavailability 35. According to the US-FDA guideline, immediate-release drug products should release 85% (T 85%) of the labelled amount of drug within 30 min of study 32.
The MNA standard curve was constructed, and the drug release profile of the Fopt, F14, F15, F16 and F17 formulations is depicted in Figure (9). Tablets of Fopt, F16 and F17, which were formulated with 12% starch paste, released 98.2%, 88% and 82% of drugs within 30 min, respectively, exhibiting good drug release properties, While tablets of F14 and F15, which formulated without 12% starch paste, released 71% and 77.5% after 30 min, respectively. Also, at 15 min the tablets of Fopt, F16 (formulated with 12% CCS paste) and F17 (formulated with 12% maize paste) released 87%, 73.5% and 49%, respectively. These results indicate that the dissolution profile is improved with an increased amount of the CCS in the formulation.
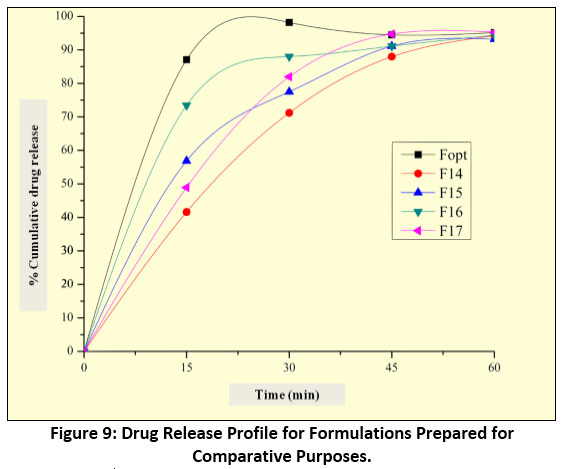 |
Figure 9: Drug Release Profile for Formulations Prepared for Comparative Purposes. Click here to view Figure |
The findings of this study have to be seen in the light of some limitations, which warrant additional investigation. The first is the effect of the rheological behaviour of the starch solution or paste on the release/binding ability of the starch. Also, thermal analysis of the CCS is needed using the TGA study. Both rheological and thermal behaviours may have a significant effect on the physical properties of the prepared tablets. Future studies of the thermal effect on CCS like TGA can be conducted.
Conclusion
The main aim of this study was to optimize and investigate the effect of the concentration of CCS and the WMT on the physical characteristics of CCS-based tablets containing metronidazole. The tested parameters hardness, friability percentage and DT were chosen as responses. The study demonstrated that the experimental design technique is a valuable tool for optimizing CCS-based formulation, which enabled a better understanding of how variant, crucial variables could influence the selected responses.
An experimental design-derived optimized formula (12% CCS paste and with 6 WMT) was used for comparative study against maize starch and sodium starch glycolate, and the following can be concluded:
- The presence of 12% starch paste in the formula led to decreased DT. Also, the tablets formulated with 12% CCS paste disintegrated faster than the tablets formulated with 12 % maize starch paste; this could be attributed to the higher amylose content, hydration capacity and swelling capacity of CCS compared to maize starch.
- The results also showed that the super disintegrant sodium starch glycolate negatively affect percentage friability.
- CCS paste positively affect the hardness of tablets and as effective as maize starch paste.
- As the results indicate, the dissolution profile is improved as CCS increases in the formulation.
Acknowledgements
The authors are profoundly grateful to all staff members of the Pharmaceutics Department, The National Ribat University, for their assistance and valuable advice.
Funding Source
There is no funding or financial support for this research work.
Conflict of Interest
The authors declare no conflict of interest, financial or otherwise.
References
- Bayor, M.T.; Tuffour E, Lambon, P.S. Evaluation of Starch From New Sweet Potato Genotypes For Use As A Pharmaceutical Diluent, Binder Or Disintegrant. JAPS, 2013, 3(8):S17-S23.
- Darji, M.A., et al., Excipient stability in oral solid dosage forms: a review. AAPS PharmSciTech, 2018, 19(1): p. 12-26.
CrossRef - Shalini, S. Advantages and Applications of Nature Excipients–A Review. Asian J Pharm Res, 2012, 2(1):30-9.
- Michaud, J. Starch-Based Excipients For Pharmaceutical Tablets In Pharmaceuticals. Pharma Chem, 2002:42-4.
- Bakheit, A.A.; Abdallah, D.B.; Hamedelniel, E.I.; Osman, Z.; Algaobahi, K.M. Comparative Physicochemical Evaluation of Starch Extracted From Cajanus cajan Seeds Grown In Sudan as A Pharmaceutical Excipient Against Maize Starch. Orient J Phys Sciences, 2017, 2(2):114-20.
CrossRef - Nwokocha, L.M.; Nwokocha, K.E.; Williams, P.A. Physicochemical Properties of Starch Isolated from Antiaris africana Seeds In Comparison With Maize Starch. Starch/Stärke, 2012, 64(3):246-54.
CrossRef - Wang, T.L., T.Y. Bogracheva, and C.L. Hedley. Starch: as simple as A, B, C?. Journal of experimental botany, 1998, 49(320): p. 481-502.
CrossRef - Polesi, L.; Sarmento, S.; Anjos, C. Composition and Characterization of Pea and Chickpea Starches. Brazilian J. Food Technol., 2011, 14(1):74-81.
CrossRef - Ihegwuagu, N.E.; Omojola, M.O.; Emeje, M.O.; Kunle, O.O. Isolation and Evaluation of Some Physicochemical Properties of Parkia biglobosa Starch. Pure and Appl Chem., 2009, 81(1):97-104.
CrossRef - Arora, S. and R. Budhiraja. Effect of polymers and excipients on the release kinetics, bioadhesion, and floatability of metronidazole tablet. Asian Journal of Pharmaceutics (AJP), 2014. 5(4).
CrossRef - Masood, Z., et al. Development and application of spectrophotometric method for quantitative determination of Metronidazole in pure and tablet formulation, Pakistan Journal of Pharmaceutical Research, 2016, 2(1): p. 28-32.
CrossRef - Ordu, J., T. Abidde, and S. Okafo. Evaluation of the binding properties of gum obtained from dried leaves of Cochoros olitorious on metronidazole tablets formulation, The Pharma Innovation, 2018, 7(5, Part J): p. 688.
- Bamiro, O.A. and A.J. Duro-Emanuel. Factorial analysis of the binding properties of acetylated ginger starch in metronidazole tablet formulations, International journal of pharmaceutical investigation, 2017, 7(1): p. 18.
CrossRef - Khalid, G., et al. Comparative FTIR, Compaction and in vitro dissolution studies of plectranthus esculentus modified starches in metronidazole tablet formulations by direct compression, Pharmaceutica Analytica Acta, 2018, 9(1): p. 1-9.
- Ofori-Kwakye, K., Y. Asantewaa, and S.L. Kipo. Physicochemical and binding properties of cashew tree gum in metronidazole tablet formulations, Int J Pharm Pharm Sci, 2010, 2(4): p. 105-109.
- Chukwu, K. and O. Udeala. Binding effectiveness of Colocassia esculenta gum in poorly compressible drugs-paracetamol and metronidazole tablet formulations, Bollettino chimico farmaceutico, 2000, 139(2): p. 89-97.
- Momoh, M.A.; Akikwu, M.U.; Ogbona, J.I.; Nwachi, U.E. In vitro study of release of metronidazole tablets prepared from okra gum, gelatin gum and their admixture, Bio-Research, 2008, 6(1): p. 339-342.
CrossRef - Nduka, S.O.; Okorie, O.; Attama, A.A.; Ugwu, M.C. Evaluation of Aloe vera gum as a binder in metronidazole based tablet, Journal of Pharmacy Research, 2012, 5(9): p. 4906-4909.
- Olayemi, O., B. Salihu, and S. Allagh. Evaluation of the binding properties of Spondias purpurea Gum in metronidazole tablet formulations, Int J Pharm Pharm Sci, 2013, 5(Suppl 2): p. 584-589.
- Olayemi, O. and O. Jacob. Preliminary evaluation of Brachystegia eurycoma seed mucilage as tablet binder, International Journal of Pharmaceutical Research and Innovation, 2011, 3(1): p. 01-06.
- Odeku, O.A. and B.O. Patani. Evaluation of dika nut mucilage (Irvingia gabonensis) as binding agent in metronidazole tablet formulations, Pharmaceutical development and technology, 2005, 10(3): p. 439-446.
CrossRef - Manek, R.V.; Builders, P.F.; Kolling, W.M.; Emeje, M.; Kunle, O.O. Physicochemical and binder properties of starch obtained from Cyperus esculentus, AAPS PharmSciTech, 2012, 13(2): p. 379-388.
CrossRef - Odeniyi, M.A. and J.O. Ayorinde. Effects of modification and incorporation techniques on disintegrant properties of wheat (Triticum aestivum) starch in metronidazole tablet formulations, Polim Med, 2014, 44(3): p. 147-155.
- Isah, A.B.; Abdulsamad, A.; Gwarzo, M.S.; Abbah, H.M. Evaluation of the disintegrant properties of microcrystalline starch obtained from cassava in metronidazole tablet formulations, Nig. J. Pharm. Sci, 2009, 8(2): p. 26-35.
- Nwachukwu, N., K.C. Ugoeze, and A.I. Alumona. Evaluation of the Binding Properties of a Polymer Obtained from Modification of Triticum aestivum Starch in Metronidazole Tablets Formulation, AJRIMPS, 2021, 10(2): p. 13-31.
CrossRef - Kukec. S.; Vre?er, F.; Dreu, R. A Study of In Situ Fluid Bed Melt Granulation Using Response Surface Methodology. Acta Pharm., 2012, 62(4):497-513.
CrossRef - Hadidi, N.; Nazari, N.; Aboofazeli, R. Formulation and Optimization of Microemulsion-Based Organogels Containing Propranolol Hydrochloride Using Experimental Design Methods. DARU, 2015, 17(3):217-24.
- Patil, S.; Yeramwar, S.; Sharma, P.; Bhargava, A. Review Of Recent Studies On Statistical Optimization In Drug Delivery Technologies. JDDT, 2014, 4(5):58-68.
CrossRef - Soares L.A.L.; Ortega, G.G.; Petrovick, P.R.; Schmidt, P.C. Optimization of Tablets Containing a High Dose of Spray-Dried Plant Extract: A Technical Note. AAPS PharmSciTech, 2005, 6(3):E367-E71.
CrossRef - Shailendra, P. Comparative Study of Binding Potency of Different Starches In Tablet Formulation. IJPBA, 2012, 3(5):1197-202.
- Okpanachi, G.O.; Musa, H.; Isah, A.B. Evaluation of Disintegrating Property of Native and Microcrystalline Starches Derived from Digitaria iburua. West African Journal of Pharmacy, 2013, 24(1):64-71.
- Onyishi, I.V.; Chime, S.A.; Ugwu, J.C. Evaluation of Binder and Disintegrant Properties of Starch Derived from Xanthosoma sagittifolium In Metronidazole Tablets. Afri. J. Biotechnol., 2013, 12(20):3064-70.
- Kittipongpatana, O.S.; Chaitep, W.; Charumanee, S.; Kittipongpatana, N. Effects of Amylose Content on the Physicochemical Properties of Sodium Carboxymethyl Rice Starches. Cmu J Nat Sci., 2006, 5:199-207.
- Abdallah, D.B.; Charoo, N.A.; Elgorashi, A.S. Comparative Binding and Disintegrating Property of Echinochloa colona Starch (Difra Starch) Against Maize, Sorghum, and Cassava Starch. Pharm. Biol., 2014, 52(8):935-43.
CrossRef - Mbah, C.; Emosairue, C.; Builders, P.; Isimi, C.; Kunle, O. Effect of Process Parameters on the Properties of Some Metronidazole Tablet and Capsule Formulations. Afri. J. Pharm Pharmacol., 2012, 6(24):1719-25.
CrossRef

This work is licensed under a Creative Commons Attribution 4.0 International License.