
On The Efficiency of Ratio Estimators of Finite Population Mean Using Auxiliary Information
Jamiu Olasunkanmi Muili1*  , Ahmed Audu2 and Ibrahim Yunusa Adamu3
1Department of Mathematics, Kebbi State University of Science and Technology Aliero, Nigeria .
2Department of Mathematics, Usmanu Danfodiyo University, Sokoto, Nigeria .
3Department of Mathematics and Statistics, Federal Polytechnic Nasarawa, Nasarawa State, Nigeria .
http://dx.doi.org/10.13005/OJPS06.01-02.03
Copy the following to cite this article:
Muili J. O, Audu A, Adamu I. Y. On The Efficiency of Ratio Estimators of Finite Population Mean Using Auxiliary Information. Oriental Jornal of Physical Sciences 2021; 6(1,2). DOI:http://dx.doi.org/10.13005/OJPS06.01-02.03
Copy the following to cite this URL:
Muili J. O, Audu A, Adamu I. Y. On The Efficiency of Ratio Estimators of Finite Population Mean Using Auxiliary Information. Oriental Jornal of Physical Sciences 2021; 6(1,2). Available From: https://bit.ly/3CoMBb3
Download article (pdf) Citation Manager Publish History



Introduction
Usage of auxiliary information is made through the ratio & product techniques of estimation to enhance estimates of the population mean. Estimation of the population mean of the variable of interest with higher precision is an unremitting issue in a sample survey. So, precision could be increased by the use of an apposite estimation procedure that consumes auxiliary information which is meticulously associated with variables of interest. In the ratio method of estimation, the auxiliary information is available which is linearly related to the variable of the study. The population parameters such as populations’ median, coefficient of kurtosis, skewness, coefficient of variation, decile, quartile, correlation, etc are auxiliary variables. The efficiency of estimators of population parameters can be increased by suitable usage of auxiliary information in relationship with auxiliary variables. Cochran1 came up with what is known as a ratio-type estimator for estimation of population mean which is more competent than the sample mean. Many authors have used different auxiliary information in order to enhance the precision of the estimates by using prior knowledge of population parameters. Researchers in sample surveys like Kadilar and Cingi2,3 developed classes of ratio estimators using known auxiliary information on coefficients of variation, & kurtosis. Abid et al.4 also suggested a set of ratio-type estimators for the population mean using non-conventional location parameters like mid-range, and tri-mean as auxiliary information. Other researchers are Upadhyaya and Singh5, Yan and Tian6, Subramani and Kumarapadiyan7, Subramani and Kumarapadiyan8, Subramani and Kumarapadiyan9, Subramani and Kumarapadiyan10, Jeelani et al11, and Nasir et al12.
The objective of this study is to develop an innovative set of ratio-type estimators to increase the precision of estimates of the population mean using known auxiliary information.
Let U = {U1, U2,........,UN} be finite population having N units & each Ui = (Xi, Yi), i = 1, 2, 3,....., N has pair of values. Y is study variable & X is auxiliary variable which is associated (correlated) with Y, in which x = {x1, x2,........,xN} & y = {y1, y2,........,yN} are the n sample values. &
 is the sample mean of the variable of interest &
  is the sample mean of auxiliary variable. s2y is the sample mean square of the study variable & s2x is the sample mean square of an auxiliary variable based on a random sample of size drawn without replacement. and S2y is the population means square of study variable and S2x is the population means square of auxiliary variable. Following are other symbols used in this study.
Y: Study variable
N: Population size
X: Auxiliary variable
n: Sample size
: Sample means of study variable
: Sample means of auxiliary variable
 : Population means of study variable
 : Population means of auxiliary variable
Spw: Probability weighted moments
p: Coefficient of correlation
Cy Coefficient of variation of study variable
Q3: The upper quartile
Cx: Coefficient of variation of auxiliary variable
QD: Population Quartile Deviation
ß2 Coefficient of skewness
ß1 Coefficient of kurtosis
G: Gini’s Mean Difference
TM: Tri-Mean
Md: Median
MR: Population mid-range
HL: Hodges-Lehman estimator
D: Downton’s Method
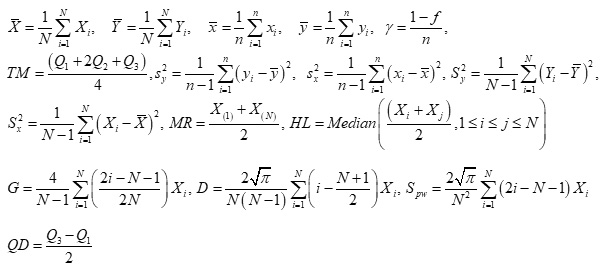
The Existing Estimators in Literature
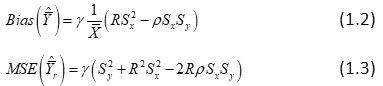
Cochran1 developed the conventional ratio estimator for estimating population mean () of study variable (Y) given as:

where R = 
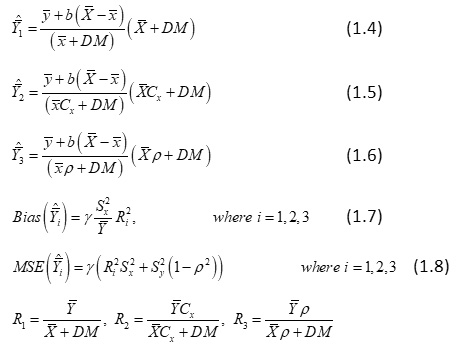
Nasir et al12 modified class of ratio type estimators for finite population mean consuming known values of coefficient of variation (Cx) & decile mean (DM) of auxiliary information, biases, constants, and mean square errors are given as:
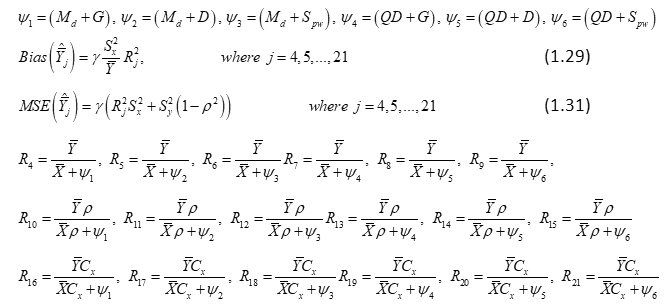
Subzar13 developed a class ratio type estimators using a linear combination of different known population parameters given as:
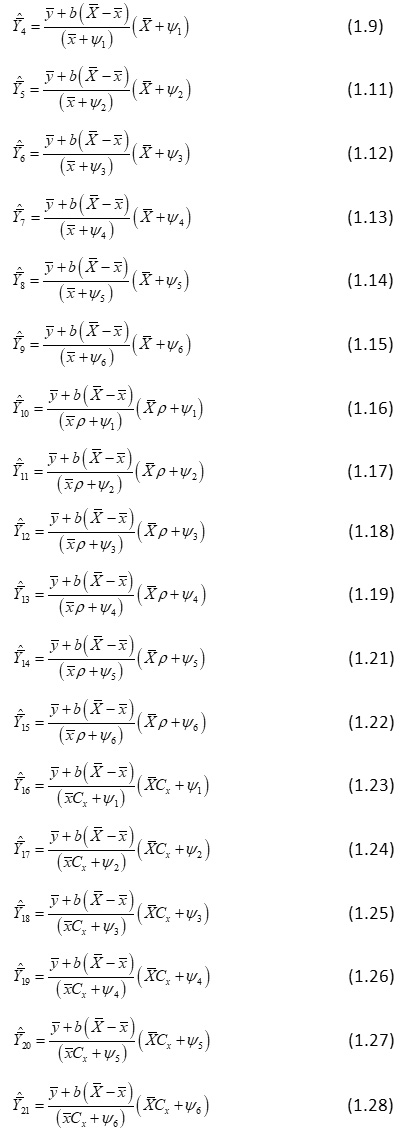
where,
Proposed Estimator
Motivated by the work of Subzar et al13, we proposed ratio-type estimators for estimating the population means using the value of Hodges-Lehmann as:
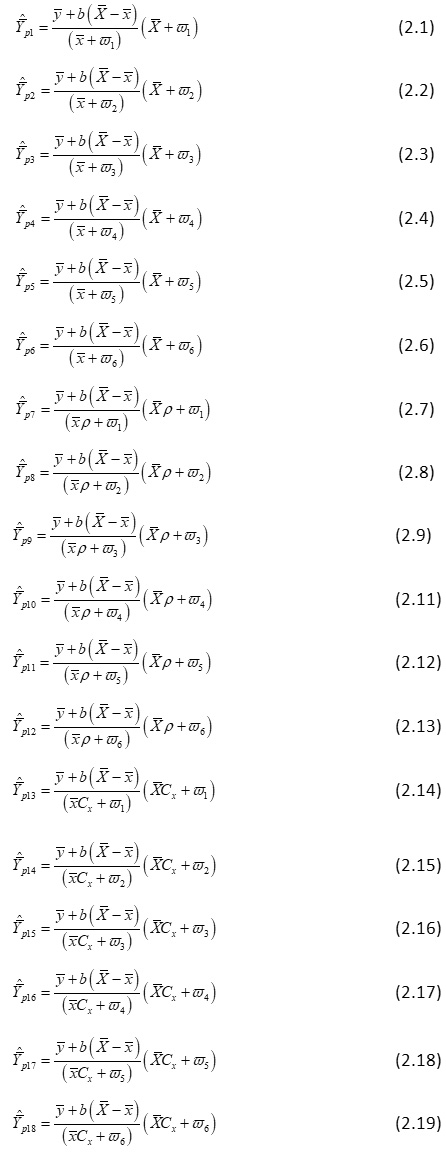
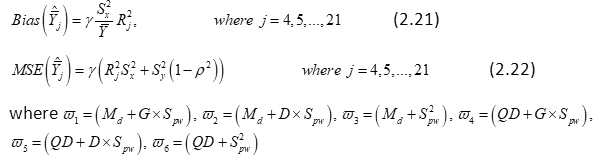
where,
In order to derive bias & mean square error,  and
and  such that,
  from the definition of e0 and e1, we obtain
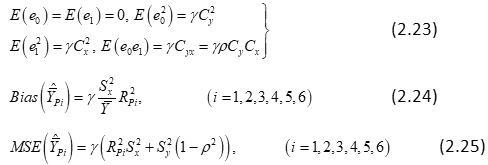
where,
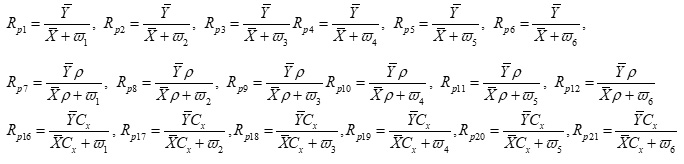
Percentage Relative Efficiency (PRE) is given as:

where  i are estimators in this study.
Efficiency Comparisons
Efficiencies of suggested estimators are compared with efficiencies of existing estimators in the study.
pi - family of proposed estimators of finite population mean is more efficient than r if,

The pi of proposed estimators of the population mean is more efficient than j if,

When conditions (2.27), and (2.28) are contented, the conclusion will be made that anticipated estimators are better and relatively efficient than other estimators in the study.
Empirical Study
To evaluate the performance of anticipated estimators, the following real populations are used.
Table 1: Characteristics of Populations [Subzar et al.13]
|
Parameter |
Population I |
Population II |
Population III |
|
N |
34 |
34 |
80 |
|
n |
20 |
20 |
20 |
|
|
856.4117 |
856.4117 |
5182.637 |
|
|
199.4412 |
208.8823 |
1126.463 |
|
p |
0.4453 |
0.4491 |
0.941 |
|
Sy |
733.1407 |
733.1407 |
1835.659 |
|
Cy |
0.8561 |
0.8561 |
0.354193 |
|
Sx |
150.2150 |
150.5059 |
845.610 |
|
Cx |
0.7531 |
0.7205 |
0.7506772 |
|
ß2 |
1.0445 |
0.0978 |
-0.063386 |
|
ß1 |
1.1823 |
0.9782 |
1.050002 |
|
Md |
142.5 |
150 |
757.5 |
|
MR |
320 |
284.5 |
1795.5 |
|
TM |
165.562 |
162.25 |
931.562 |
|
HL |
320 |
190 |
1040.5 |
|
QD |
184 |
80,25 |
588.125 |
|
G |
162.996 |
155.446 |
901.081 |
|
D |
144.481 |
140.891 |
801.381 |
|
S pw |
206.944 |
199.961 |
791.364 |
|
DM |
206.944 |
234.82 |
1150.7 |
Table 2: Constant and Bias of Some Selected Existing and Proposed Estimators.
|
Estimator |
Constant |
Bias |
||||
|
Pop-I |
Pop-II |
Pop-III |
Pop-I |
Pop-II |
Pop-III |
|
|
|
4.294 |
4.100 |
4.601 |
4.940 |
4.270 |
60.877 |
|
|
2.107 |
1.9301 |
2.276 |
2.137 |
2.2087 |
26.800 |
|
|
1.806 |
1.6013 |
1.949 |
1.483 |
1.3964 |
19.650 |
|
|
1.289 |
1.1703 |
2.206 |
0.800 |
0.7459 |
25.188 |
|
|
1.6960 |
1.6651 |
1.9813 |
1.5604 |
1.5098 |
20.312 |
|
|
1.7606 |
1.7136 |
2.0598 |
1.6815 |
1.599 |
21.953 |
|
|
1.5602 |
1.5324 |
2.0681 |
1.3205 |
1.2788 |
22.129 |
|
|
1.8955 |
1.9263 |
1.8608 |
1.9490 |
2.0207 |
17.916 |
|
|
1.9764 |
1.9915 |
1.9299 |
2.1191 |
1.9915 |
2.1598 |
|
|
1.7274 |
1.751 |
1.9371 |
1.6187 |
1.6696 |
19.416 |
|
|
0.9671 |
0.9633 |
1.7938 |
0.5074 |
0.5053 |
16.650 |
|
|
1.0148 |
0.9997 |
1.8622 |
0.5586 |
0.5443 |
17.942 |
|
|
0.8701 |
0.8666 |
1.8693 |
0.4107 |
0.409 |
18.079 |
|
|
1.1177 |
1.1672 |
1.9130 |
0.6777 |
0.7419 |
18.936 |
|
|
1.1818 |
1.2211 |
1.9909 |
0.7577 |
0.8121 |
20.508 |
|
|
0.9902 |
1.0283 |
1.9991 |
0.5318 |
0.5758 |
20.677 |
|
|
1.4153 |
1.3533 |
1.5540 |
1.0866 |
0.9973 |
12.495 |
|
|
1.4752 |
1.3979 |
1.6184 |
1.1806 |
1.0642 |
13.552 |
|
|
1.2908 |
1.2329 |
1.6252 |
0.9038 |
0.8278 |
13.666 |
|
|
1.6021 |
1.5977 |
1.6667 |
1.3923 |
1.3901 |
14.373 |
|
|
1.6793 |
1.6603 |
1.7410 |
1.5298 |
1.5011 |
15.684 |
|
|
1.4444 |
1.4326 |
1.7489 |
1.1317 |
1.1176 |
15.825 |
|
|
0.0005
|
0.0335 |
0.0061 |
0.0313 |
0.0006 |
0.0002 |
|
|
0.0007 |
0.0369 |
0.0069 |
0.0353 |
0.0007 |
0.0002 |
|
|
0.0003 |
0.0261 |
0.0070 |
0.0247 |
0.0004 |
0.0003 |
|
|
0.0005 |
0.0334 |
0.0062 |
0.0313 |
0.0006 |
0.0002 |
|
|
0.0007 |
0.0368 |
0.0069 |
0.0352 |
0.0007 |
0.0002 |
|
|
0.0003 |
0.0261 |
0.0070 |
0.0247 |
0.0004 |
0.0003 |
|
|
0.0005 |
0.0336 |
0.0062 |
0.0315 |
0.0006 |
0.0002 |
|
|
0.0007 |
0.0371 |
0.0069 |
0.0355 |
0.0007 |
0.0002 |
|
|
0.0003 |
0.0262 |
0.0070 |
0.0248 |
0.0004 |
0.0003 |
|
|
0.0005 |
0.0336 |
0.0062 |
0.0314 |
0.0006 |
0.0002 |
|
|
0.0007 |
0.0370 |
0.0069 |
0.0354 |
0.0007 |
0.0002 |
|
|
0.0003 |
0.0262 |
0.0070 |
0.0248 |
0.0004 |
0.0003 |
|
|
0.0005 |
0.0336 |
0.0062 |
0.0314 |
0.0006 |
0.0002 |
|
|
0.0007 |
0.0370 |
0.0069 |
0.0354 |
0.0007 |
0.0002 |
|
|
0.0003 |
0.0262 |
0.00701 |
0.0248 |
0.0004 |
0.0003 |
|
|
0.0005 |
0.0335 |
0.0062 |
0.0313 |
0.0006 |
0.0002 |
|
|
0.0007 |
0.0369 |
0.0069 |
0.0353 |
0.0007 |
0.0002 |
|
|
0.0003 |
0.0261 |
0.0070 |
0.0248 |
0.0004 |
0.0003 |
Table 2 shows the constant and bias of estimators
Table 3: MSE and PRE of Estimators.
|
Estimator |
MSE |
PRE |
||||
|
Pop-I |
Pop-II |
Pop-III |
Pop-I |
Pop-II |
Pop-III |
|
|
|
10960.76 |
10539.27 |
189775.1 |
100 |
100 |
100 |
|
|
10934.74 |
10571.58 |
153292.6 |
100.238 |
99.69437 |
123.7993 |
|
|
10386.83 |
10030.11 |
116239.3 |
105.5256 |
105.0763 |
163.2624 |
|
|
9644.04 |
9472.95 |
144936.7 |
113.6532 |
111.2565 |
130.9365 |
|
|
10208.16 |
10333.07 |
119741.5 |
107.3725 |
101.9955 |
158.4873 |
|
|
10311.83 |
10203.59 |
128249.9 |
106.2931 |
103.2898 |
147.9729 |
|
|
10002.72 |
9929.39 |
129161.3 |
109.5778 |
106.1422 |
146.9288 |
|
|
10540.91 |
10564.74 |
107326.5 |
103.9831 |
99.75892 |
176.8204 |
|
|
10686.6 |
10683.87 |
114349.5 |
102.5655 |
98.64656 |
165.9606 |
|
|
10258.09 |
10264.06 |
115098.9 |
106.8499 |
102.6813 |
164.88 |
|
|
9306.32 |
9266.94 |
100762.1 |
117.7776 |
113.7298 |
188.3398 |
|
|
9350.19 |
9300.31 |
107457.3 |
117.225 |
113.3217 |
176.6051 |
|
|
9223.53 |
9184.47 |
108172.8 |
118.8348 |
114.751 |
175.437 |
|
|
9452.18 |
9469.56 |
112609.8 |
115.9601 |
111.2963 |
168.5245 |
|
|
9250.7 |
9529.64 |
120761.3 |
118.4857 |
110.5946 |
157.1489 |
|
|
9327.27 |
9327.31 |
121636.1 |
117.5131 |
112.9937 |
156.0187 |
|
|
9802.37 |
9688.30 |
79228.58 |
111.8174 |
108.7835 |
239.5286 |
|
|
9882.86 |
9745.56 |
84709.31 |
110.9068 |
108.1443 |
224.031 |
|
|
9645.86 |
9543.10 |
85298.12 |
113.6318 |
110.4386 |
222.4845 |
|
|
10064.19 |
10024.69 |
88963.27 |
108.9085 |
105.1331 |
213.3185 |
|
|
10181.93 |
10119.77 |
95756.01 |
107.6491 |
104.1454 |
198.1861 |
|
|
9841.01 |
9791.32 |
96489.29 |
111.3784 |
107.6389 |
196.68 |
|
|
8872.22 |
8834.676 |
14471.83 |
123.5402 |
119.2944 |
1311.341 |
|
|
8872.342 |
8834.787 |
14472.1 |
123.5385 |
119.2929 |
1311.317 |
|
|
8872.048 |
8834.471 |
14472.13 |
123.5426 |
119.2971 |
1311.314 |
|
|
8872.218 |
8834.674 |
14471.83 |
123.5402 |
119.2944 |
1311.341 |
|
|
8872.34 |
8834.786 |
14472.1 |
123.5385 |
119.2929 |
1311.317 |
|
|
8872.047 |
8834.47 |
14472.13 |
123.5426 |
119.2971 |
1311.314 |
|
|
8872.223 |
8834.68 |
14471.83 |
123.5402 |
119.2943 |
1311.341 |
|
|
8872.348 |
8834.794 |
14472.1 |
123.5384 |
119.2928 |
1311.317 |
|
|
8872.05 |
8834.473 |
14472.13 |
123.5426 |
119.2971 |
1311.314 |
|
|
8872.222 |
8834.679 |
14471.83 |
123.5402 |
119.2943 |
1311.341 |
|
|
8872.346 |
8834.792 |
14472.1 |
123.5385 |
119.2928 |
1311.317 |
|
|
8872.049 |
8834.472 |
14472.13 |
123.5426 |
119.2971 |
1311.314 |
|
|
872.221 |
8834.678 |
14471.83 |
123.5402 |
119.2943 |
1311.341 |
|
|
8872.345 |
8834.791 |
14472.1 |
123.5385 |
119.2928 |
1311.317 |
|
|
8872.049 |
8834.472 |
14472.13 |
123.5426 |
119.2971 |
1311.314 |
|
|
8872.22 |
8834.677 |
14471.83 |
123.5402 |
119.2943 |
1311.341 |
|
|
8872.343 |
8834.789 |
14472.1 |
123.5385 |
119.2928 |
1311.317 |
|
|
8872.048 |
8834.471 |
14472.13 |
123.5426 |
119.2971 |
1311.314 |
Table 3 shows the mean square error (MSE) & percentage relative efficiency (PRE) for the three populations.
Results and Discussion
Class of ratio estimators of finite population means is proposed and performance of anticipated estimators over existing estimators was established. The scope of the study is to analyze and estimate the biases, mean square errors of anticipated estimators, and efficiency comparison with some existing estimators. Tables 2 and 3 show the results of the Constant, Bias, Mean Square Error (MSE) & Percentage Relative Efficiency (PRE) of anticipated & existing estimators considered in the study for all populations used. Outcomes also discovered that anticipated estimators have the least MSE and advanced PRE than other estimators. The outcomes also show that the average dispersion of anticipated estimators gives better estimates on the average compared to other estimators considered.
Future Scope
The future scope of the study is to transform the sampling technique from simple random sampling to other sampling techniques like stratified sampling, two-stage sampling, cluster sampling, or successive sampling.
Conclusion
In Table 3, anticipated estimators performed better than prevailing estimators considered in the study. So, it is clear that anticipated estimators performed superior to other estimators having minimum Mean Square Error (MSE) & highest Percentage Relative Error (PRE). We, therefore, conclude that anticipated estimators are relatively efficient and better than other estimators for the estimation of the population mean.
Funding Sources
The authors received no financial support for the research, authorship, and/or publication of this article.
Conflict of Interest
The authors declare no conflict of interest.
References
- Cochran W. G., Sampling Techniques, 3rd Edition. Wiley Eastern Limited, India, 1940.
- Kadilar C. and Cingi H., Ratio Estimators in Simple Random Sampling. Applied Mathematics and Computation 151: 893 – 902, (2004).
CrossRef - Kadilar C. and Cingi H., An Improvement in estimating the population means by using the correlation coefficient. Hacettepe Journal of Mathematics and Statistics 35, 103 – 109, (2006).
- Abid M., Abbas N., Nazir H. Z., and Lin Z., Enhancing the Mean Ratio Estimators for Estimating Population Mean Using Non-Conventional Location Parameters. Revista Colombiana de Estadistica. 39(1), 63 – 79, (2016).
CrossRef - Upadhyaya L. N. and Singh H. P., Use of Transformed Auxiliary Variable in Estimating the Finite Population Mean. Biometrical Journal, 41:627 – 636, (1999).
CrossRef - Yan, Z. and Tian B., Ratio Method to the Mean Estimation using Coefficient of Skewness of Auxiliary Variable. In: Information Computing and Applications. ICICA, (2010).
CrossRef - Subramani J. and Kumarapandiyan G., A Class of almost Unbiased Modified Ratio Estimators for Population Mean with known Population Parameters. Elixir Statistics 44: 7411 – 7415, (2012a).
- Subramani J. and Kumarapandiyan G., Estimation of Population Mean using Co-efficient of Variation and Median of an Auxiliary Variable. International Journal of Probability and Statistics 1, 111 – 118, (2012b).
CrossRef - Subramani J. and Kumarapandiyan G., Estimation of Population Mean using known Median and Co-efficient of Skewness. American Journal of Mathematics and Statistics 2, 101 – 107, (2012c).
CrossRef - Subramani J. and Kumarapandiyan G., Modified Ratio Estimators using known Median and Co-efficient of Kurtosis. American Journal of Mathematics and Statistics, 2, 95 – 100, (2012d).
CrossRef - Jeelani M. I. Maqbool S. and Mir S. A., Modified Ratio Estimators of Population Mean using Linear Combination of Coefficient of Skewness and Quartile Deviation. International Journal of Modern Mathematical Sciences 6, 174 – 183, (2013).
CrossRef - Nasir A., Muhammad A., Muhammad T., and Zawar H. Enhancing Ratio Estimators for Estimating Population Mean using Maximum value of Auxiliary Variable. Journal of the National Science Foundation of Sri Lanka, 46(3), 453 – 463, (2018).
CrossRef - Subzar M. Maqbool S., Raja T. A., Surya K. P., and Sharma P., Efficient Estimators of Population Mean Using Auxiliary Information Under Simple Random Sampling. Statistics in Transition new series. 19(2), 1 – 20, (2018).
CrossRef

This work is licensed under a Creative Commons Attribution 4.0 International License.